Quantcast
Channel: TechNet Technology News
Viewing all 13502 articles
Browse latest View live

Graph math equations with Ink math assistant in OneNote for Windows 10

$
0
0

Last summer we introduced Ink math assistant in OneNote—a digital tutor that gives you step-by-step instructions on how to solve your handwritten math problems. Today, we are excited to announce that Ink math assistant can draw graphs of your equations, all within OneNote for Windows 10.

Now, when you write your math equations, the Ink math assistant quickly plots an interactive graph to help you visualize those difficult math concepts. You can zoom in and move the graph to observe intersection points or change values of parameters in your equations to better understand how each of them reflects on the graph. Finally, you can save a screenshot of the graph directly to your page to revisit it later.

Five steps to graph an equation in OneNote

  1. Begin by writing your equation. For example: y=x+3 or y=sin(x)+cos(2x).
  2. Next, use Lasso tool to select the equation and then, on the Draw tab, click the Math button.
  3. From the drop-down menu in Math pane, select the option to Graph in 2D. You can play with the interactive graph of your equation—use a single finger to move the graph position or two fingers to change the zoom level.
  4. Use + and buttons to change the values of the parameters in your equation.
  5. Finally, click the Insert on Page button to add a screenshot of the graph to your page.

Availability: Ink math assistant is available in OneNote for Windows 10, for Office 365 subscribers.

As always, we would love to hear your feedback, so please make comments below or suggest and vote on future ideas on OneNote UserVoice page.

For more information, check out our support page.

—Mina Spasic, program manager for the Math team

The post Graph math equations with Ink math assistant in OneNote for Windows 10 appeared first on Office Blogs.


Creators Update SDK support in Visual Studio 2017

$
0
0
Creators Update SDK support in Visual Studio 2017

Take Advantage of Scalable Cloud Compute Directly from Your R Session, with doAzureParallel

$
0
0

Re-posted from the Azure blog.

For users of the R language, scaling up their work to take advantage of cloud compute has generally been a complex undertaking. We are therefore excited to announce doAzureParallel, a lightweight R package built on Azure Batch that allows you to easily use Azure’s flexible compute resources right from your R session. doAzureParallel complements Microsoft R Server and provides the infrastructure for you to run massively parallel simulations.

The doAzureParallel package is a parallel backend for the popular foreach package that lets you execute multiple processes across a cluster of Azure virtual machines. With just a few lines of code, the package helps you create and manage a cluster in Azure, and register it as a parallel backend to be used with foreach.


With doAzureParallel, there is no need to manually create, configure and manage a cluster of individual VMs. Running your scale jobs is as easy running algorithms on your local machine. With Azure Batch’s autoscaling capabilities, you can also increase or decrease your cluster size to fit your workloads, saving you time and money. doAzureParallel also uses the Azure Data Science Virtual Machine (DSVM), allowing Azure Batch to easily and quickly configure the appropriate environment in as little time as possible.

doAzureParallel is ideal for running embarrassingly parallel work such as parametric sweeps or Monte Carlo simulations, making it a great fit for many financial modelling algorithms (back-testing, portfolio scenario modelling, etc).

There is no additional cost for these capabilities – you only pay for the Azure VMs you use. For more detailed information, including installation steps and demo code, check out the original blog post here

CIML Blog Team

This is a Can’t-Miss Episode of “The Endpoint Zone”

$
0
0

Maybe I’m biased, but I think every EPZ episode is great – but this one is GREAT.

In this episode we dive in on a coupleEMM stat that I think you’ll find pretty shocking, as well as:

  • A bunch of new EMS demos.
  • OneDrive for business policy integration in the Office 365 console
  • Custom dashboards with PowerBI
  • Conditional Access policy that lets you express organizational risk tolerance
  • Device compliance
  • And the new Intune on Azure Console!

Wow!

g

The successful hybrid cloud deployment checklist

$
0
0

Organizations often lack the technology prerequisites needed to fully realize hybrid cloud capabilities. In this article, we explore two of the four critical competencies that mark a successful hybrid deployment, with recommendations on how some of these capabilities can be best achieved.

The four pillars of successful cloud deployment

As Gartner reports, companies that have successfully realized the full benefits of their hybrid cloud strategies demonstrate mature competence in four key areas, specifically:

  • Virtualization
  • Standardization
  • Automation
  • Instrumentation

Organizations must evaluate their competencies in these disciplines objectively and be aware that the level of maturity they develop in each area can directly impact the level of benefits they can expect from their hybrid cloud.

1. Virtualize more than your compute environment

As you probably already know, virtualizing as many things as you can saves you money and time. However, the organization looking to leverage the full benefits from their hybrid cloud should focus on extending virtualization beyond compute storage. To help understand your readiness, consider the following:

  • Have you targeted your virtualizing infrastructure silos for applications that can be virtualized?
  • Have you achieved at least an 80 percent virtualization level at the compute layer?
  • Have you procured compute, storage, and networking that can be leveraged by any cloud management platform?

2. Standardize components that make up the services

Standardization can help dramatically reduce the diversity of an organizations infrastructure services. Hardware standardization allows easier pooling of resources. Likewise, software standardization can have a profound impact on provisioning, patching, and governance. When assessing your competence in this area consider:

  • Have you standardized all components wherever possible?
  • Have you instituted a formal governance process for new products, a process that includes multiple IT disciplines and can ensure standards are known throughout the organization?
  • Have you made it difficult to add components without valid business reasons?

Are you getting the full benefits of the hybrid cloud? Download this report and find out what your organization needs.

While many organizations have developed mature competencies in virtualization and standardization, as deployments grow, the need for similar competencies in automation and instrumentation become rapidly apparent.

The degree to which an organization can eliminate infrastructure and operational tasks, as well as provide real-time visibility into infrastructure and application components, directly impacts the level of benefits they can expect from their hybrid cloud deployment.

For in-depth recommendations on how to develop the competencies required for a successful hybrid cloud deployment, get the Gartner report: Successful Hybrid Cloud Deployment Requires Maturity in Four Key Areas.

Episode 122 on Microsoft Graph webhooks, delta queries, and extensions with Jeff Sakowicz—Office 365 Developer Podcast

$
0
0

In episode 122 of the Office 365 Developer Podcast, Richard diZerega and Andrew Coates to Jeff Sakowicz about new Microsoft Graph features such as webhooks, delta queries and extensions.

Download the podcast.

Weekly updates

Show notes

Got questions or comments about the show? Join the O365 Dev Podcast on the Office 365 Technical Network. The podcast RSS is available on iTunes or search for it at “Office 365 Developer Podcast” or add directly with the RSS feeds.feedburner.com/Office365DeveloperPodcast.

About Jeff Sakowicz

Jeff Sakowicz is a program manager on the Microsoft Graph API team within the Cloud and Enterprise division in Redmond. His focus is on various platform capabilities like Delta Query, Webhooks, Hybrid, and the consent and permissions framework along with various Identity/Directory APIs. In his career at Microsoft, he has had a number of roles in the identity, collaboration and cloud productivity spaces. Before working on Microsoft Graph Jeff was on the Azure Active Directory PM team and previous to that he was a Support Escalation Engineer on the Cloud Identity team in Charlotte, NC.


About the hosts

RIchard diZeregaRichard is a software engineer in Microsoft’s Developer Experience (DX) group, where he helps developers and software vendors maximize their use of Microsoft cloud services in Office 365 and Azure. Richard has spent a good portion of the last decade architecting Office-centric solutions, many that span Microsoft’s diverse technology portfolio. He is a passionate technology evangelist and a frequent speaker at worldwide conferences, trainings and events. Richard is highly active in the Office 365 community, popular blogger at aka.ms/richdizz and can be found on Twitter at @richdizz. Richard is born, raised and based in Dallas, TX, but works on a worldwide team based in Redmond. Richard is an avid builder of things (BoT), musician and lightning-fast runner.


ACoatesA Civil Engineer by training and a software developer by profession, Andrew Coates has been a Developer Evangelist at Microsoft since early 2004, teaching, learning and sharing coding techniques. During that time, he’s focused on .NET development on the desktop, in the cloud, on the web, on mobile devices and most recently for Office. Andrew has a number of apps in various stores and generally has far too much fun doing his job to honestly be able to call it work. Andrew lives in Sydney, Australia with his wife and two almost-grown-up children.

Useful links

StackOverflow

Yammer Office 365 Technical Network

The post Episode 122 on Microsoft Graph webhooks, delta queries, and extensions with Jeff Sakowicz—Office 365 Developer Podcast appeared first on Office Blogs.

SQL Server on Linux: Running jobs with SQL Server Agent

$
0
0

In keeping with our goal to enable SQL Server features across all platforms supported by SQL Server, Microsoft is excited to announce the preview of SQL Server Agent on Linux in SQL Server vNext Community Technology Preview (CTP) 1.4.

SQL Server Agent is a component that executes scheduled administrative tasks, called “jobs.” Jobs contain one or more job steps. Each step contains its own task such as backing up a database. SQL Server Agent can run a job on a schedule, in response to a specific event, or on demand. For example, if you want to back up all the company databases every weekday after hours, you can automate doing so by scheduling an Agent job to run a backup at 22:00 Monday through Friday.

We have released SQL Server Agent packages for Ubuntu, RedHat Enterprise Linux, and SUSE Linux Enterprise Server that you can install via apt-get, yum, and zypper. Once you install these packages, you can create T-SQL Jobs using SSMS, sqlcmd, and other GUI and command line tools.

Here is a simple example:

  • Create a job

CREATE DATABASE SampleDB ;

USE msdb ;

GO

EXEC dbo.sp_add_job

@job_name = N’Daily SampleDB Backup’ ;

GO

  • Add one or more job steps

EXEC sp_add_jobstep

@job_name = N’Daily SampleDB Backup’,

@step_name = N’Backup database’,

@subsystem = N’TSQL’,

@command = N’BACKUP DATABASE SampleDB TO DISK = \

N”/var/opt/mssql/data/SampleDB.bak” WITH NOFORMAT, NOINIT, \

NAME = ”SampleDB-full”, SKIP, NOREWIND, NOUNLOAD, STATS = 10′,

@retry_attempts = 5,

@retry_interval = 5 ;

GO

  • Create a job schedule

EXEC dbo.sp_add_schedule

@schedule_name = N’Daily SampleDB’,

@freq_type = 4,

@freq_interval = 1,

@active_start_time = 233000 ;

USE msdb ;

GO

  • Attach the schedule and add the job server

EXEC sp_attach_schedule

@job_name = N’Daily SampleDB Backup’,

@schedule_name = N’Daily SampleDB’;

GO

EXEC dbo.sp_add_jobserver

@job_name = N’Daily SampleDB Backup’,

@server_name = N'(LOCAL)’;

GO

  • Start job

EXEC dbo.sp_start_job N’ Daily SampleDB Backup’ ;

GO

Limitations:

The following types of SQL Agent jobs are not currently supported on Linux:

  • Subsystems: CmdExec, PowerShell, Replication Distributor, Snapshot, Merge, Queue Reader, SSIS, SSAS, SSRS
  • Alerts
  • DB Mail
  • Log Shipping
  • Log Reader Agent
  • Change Data Capture

Get started

If you’re ready to get started with SQL Server on Linux, here’s how to install the SQL Server Agent package via apt-get, yum, and zypper. And here’s how to create your first T-SQL job and show you to use SSMS with SQL Agent.

Learn more

SQL Server next version CTP 1.4 now available

$
0
0

Microsoft is excited to announce a new preview for the next version of SQL Server (SQL Server v.Next). Community Technology Preview (CTP) 1.4 is available on both Windows and Linux. In this preview, we added the ability to schedule jobs using SQL Server Agent on Linux. You can try the preview in your choice of development and test environments now: www.sqlserveronlinux.com.

Key CTP 1.4 enhancements

The primary enhancement to SQL Server v.Next on Linux in this release is the ability to schedule jobs using SQL Server Agent. This functionality helps administrators automate maintenance jobs and other tasks, or run them in response to an event. Some SQL Server Agent functionality is not yet enabled for SQL Server on Linux. To learn more and see sample SQL Server Agent jobs, you can read our detailed blog titled “SQL Server on Linux: Running scheduled jobs with SQL Server Agent” <link to blog request #909> or attend an Engineering Town Hall about “SQL Server Agent and Full Text Search in SQL Server on Linux.”

The mssql-server-linux container image on Docker Hub now includes the sqlcmd and bcp command line utilities to make it easier to create and attach databases and automate other actions when working with containers. For additional detail on CTP 1.4, please visit What’s New in SQL Server v.Next, Release Notes and Linux documentation.

In addition, SQL Server Analysis Services and SQL Server Reporting Services developer tools now support Visual Studio 2017. They are available for installation from the Visual Studio Marketplace providing the option for automatic updates going forward.

Get SQL Server v.Next CTP 1.4 today!

Try the preview of the next release of SQL Server today! Get started with the preview of SQL Server with our developer tutorials that show you how to install and use SQL Server v.Next on macOS, Docker, Windows, and Linux and quickly build an app in a programming language of your choice.

Have questions? Join the discussion of SQL Server v.Next at MSDN. If you run into an issue or would like to make a suggestion, you can let us know through Connect. We look forward to hearing from you!


ICYMI – Your weekly TL;DR

$
0
0

Were you heads-down this week? Check out what you may have missed from Windows Developer before heading into the weekend.

Complete Anatomy: Award-Winning App Comes to Windows Store

3D4Medical quickly completed the port of its award-winning flagship product Complete Anatomy for the Windows Store using the Windows Bridge for iOS. Learn how they did it.

Windows 10 SDK Preview Build 15052 Released!

A new Windows 10 Creators Update SDK Preview was released this week! Read about what’s new in 15052.

Monetize your game app with Playtem ads

Here’s something any would-be game developer who wants to find a good monetization strategy needs to know: people don’t like to spend money on digital content, even when it’s only a couple of bucks. A price tag can even be a drag on download numbers. Which is why Playtem’s monetization strategy is really interesting. Check out what makes them different.

New Year, New Dev — Video Capture and Media Editing — Part 1

Check out the first of two posts on how to properly capture video and edit it using UWP’s powerful, but easy to use, MediaCapture and MediaComposition APIs.

Download Visual Studio to get started.

The Windows team would love to hear your feedback. Please keep the feedback coming using our Windows Developer UserVoice site. If you have a direct bug, please use the Windows Feedback tool built directly into Windows 10.

The post ICYMI – Your weekly TL;DR appeared first on Building Apps for Windows.

Use NGINX to load balance across your Docker Swarm cluster

$
0
0

A practical walkthrough, in six steps

This basic example demonstrates NGINX and swarm mode in action, to provide the foundation for you to apply these concepts to your own configurations.

This document walks through several steps for setting up a containerized NGINX server and using it to load balance traffic across a swarm cluster. For clarity, these steps are designed as an end-to-end tutorial for setting up a three node cluster and running two docker services on that cluster; by completing this exercise, you will become familiar with the general workflow required to use swarm mode and to load balance across Windows Container endpoints using an NGINX load balancer.

The basic setup

This exercise requires three container hosts–two of which will be joined to form a two-node swarm cluster, and one which will be used to host a containerized NGINX load balancer. In order to demonstrate the load balancer in action, two docker services will be deployed to the swarm cluster, and the NGINX server will be configured to load balance across the container instances that define those services. The services will both be web services, hosting simple content that can be viewed via web browser. With this setup, the load balancer will be easy to see in action, as traffic is routed between the two services each time the web browser view displaying their content is refreshed.

The figure below provides a visualization of this three-node setup. Two of the nodes, the “Swarm Manager” node and the “Swarm Worker” node together form a two-node swarm mode cluster, running two Docker web services, “S1” and “S2”. A third node (the “NGINX Host” in the figure) is used to host a containerized NGINX load balancer, and the load balancer is configured to route traffic across the container endpoints for the two container services. This figure includes example IP addresses and port numbers for the two swarm hosts and for each of the six container endpoints running on the hosts.

configuration

System requirements

Three* or more computer systems running Windows 10 Creators Update (available today for members of the Windows Insiders program), setup as a container host (see the topic, Windows Containers on Windows 10 for more details on how to get started with Docker containers on Windows 10).

Additionally, each host system should be configured with the following:

  • The microsoft/windowsservercore container image
  • Docker Engine v1.13.0 or later
  • Open ports: Swarm mode requires that the following ports be available on each host.
    • TCP port 2377 for cluster management communications
    • TCP and UDP port 7946 for communication among nodes
    • TCP and UDP port 4789 for overlay network traffic

*Note on using two nodes rather than three:
These instructions can be completed using just two nodes. However, currently there is a known bug on Windows which prevents containers from accessing their hosts using localhost or even the host’s external IP address (for more background on this, see Caveats and Gotchas below). This means that in order to access docker services via their exposed ports on the swarm hosts, the NGINX load balancer must not reside on the same host as any of the service container instances.
Put another way, if you use only two nodes to complete this exercise, one of them will need to be dedicated to hosting the NGINX load balancer, leaving the other to be used as a swarm container host (i.e. you will have a single-host swarm cluster, a host dedicated to hosting your containerized NGINX load balancer).

Step 1: Build an NGINX container image

In this step, we’ll build the container image required for your containerized NGINX load balancer. Later we will run this image on the host that you have designated as your NGINX container host.

Note: To avoid having to transfer your container image later, complete the instructions in this section on the container host that you intend to use for your NGINX load balancer.

NGINX is available for download from nginx.org. An NGINX container image can be built using a simple Dockerfile that installs NGINX onto a Windows base container image and configures the container to run as an NGINX executable. For the purpose of this exercise, I’ve made a Dockerfile downloadable from my personal GitHub repo–access the NGINX Dockerfile here, then save it to some location (e.g. C:\temp\nginx) on your NGINX container host machine. From that location, build the image using the following command:

C:\temp\nginx> docker build -t nginx .

Now the image should appear with the rest of the docker images on your system (check using the docker images command).

(Optional) Confirm that your NGINX image is ready

First, run the container:

C:\temp> docker run -it -p 80:80 nginx

Next, open a new cmdlet window and use the docker ps command to see that the container is running. Note its ID. The ID of your container is the value of in the next command.

Get the container’s IP address:

C:\temp> docker exec  ipconfig

For example, your container’s IP address may be 172.17.176.155, as in the example output shown below.

nginxipconfig

Next, open a browser on your container host and put your container’s IP address in the address bar. You should see a confirmation page, indicating that NGINX is successfully running in your container.

nginxconfirmation


Step 2: Build images for two containerized IIS Web services

In this step, we’ll build container images for two simple IIS-based web applications. Later, we’ll use these images to create two docker services.

Note: Complete the instructions in this section on one of the container hosts that you intend to use as a swarm host.

Build a generic IIS Web Server image

On my personal GitHub repo, I have made a simple Dockerfile available for creating an IIS Web server image. The Dockerfile simply enables the Internet Information Services (IIS) Web server role within a microsoft/windowsservercore container. Download the Dockerfile from here, and save it to some location (e.g. C:\temp\iis) on one of the host machines that you plan to use as a swarm node. From that location, build the image using the following command:

 C:\temp\iis> docker build -t iis-web .

(Optional) Confirm that your IIS Web server image is ready

First, run the container:

 C:\temp> docker run -it -p 80:80 iis-web

Next, use the docker ps command to see that the container is running. Note its ID. The ID of your container is the value of in the next command.

Get the container’s IP address:

C:\temp> docker exec ipconfig

Now open a browser on your container host and put your container’s IP address in the address bar. You should see a confirmation page, indicating that the IIS Web server role is successfully running in your container.

iisconfirmation

Build two custom IIS Web server images

In this step, we’ll be replacing the IIS landing/confirmation page that we saw above with custom HTML pages–two different images, corresponding to two different web container images. In a later step, we’ll be using our NGINX container to load balance across instances of these two images. Because the images will be different, we will easily see the load balancing in action as it shifts between the content being served by the containers we’ll define in this step.

First, on your host machine create a simple file called, index_1.html. In the file type any text. For example, your index_1.html file might look like this:

index1

Now create a second file, index_2.html. Again, in the file type any text. For example, your index_2.html file might look like this:

index2

Now we’ll use these HTML documents to make two custom web service images.

If the iis-web container instance that you just built is not still running, run a new one, then get the ID of the container using:

C:\temp> docker exec  ipconfig

Now, copy your index_1.html file from your host onto the IIS container instance that is running, using the following command:

C:\temp> docker cp index_1.html :C:\inetpub\wwwroot\index.html

Next, stop and commit the container in its current state. This will create a container image for the first web service. Let’s call this first image, “web_1.”

C:\> docker stop 
C:\> docker commit  web_1

Now, start the container again and repeat the previous steps to create a second web service image, this time using your index_2.html file. Do this using the following commands:

C:\> docker start 
C:\> docker cp index_2.html :C:\inetpub\wwwroot\index.html
C:\> docker stop 
C:\> docker commit  web_2

You have now created images for two unique web services; if you view the Docker images on your host by running docker images , you should see that you have two new container images—“web_1” and “web_2”.

Put the IIS container images on all of your swarm hosts

To complete this exercise you will need the custom web container images that you just created to be on all of the host machines that you intend to use as swarm nodes. There are two ways for you to get the images onto additional machines:

Option 1:Repeat the steps above to build the “web_1” and “web_2” containers on your second host.
Option 2 [recommended]:Push the images to your repository on Docker Hub then pull them onto additional hosts.

Using Docker Hub is a convenient way to leverage the lightweight nature of containers across all of your machines, and to share your images with others. Visit the following Docker resources to get started with pushing/pulling images with Docker Hub:
Create a Docker Hub account and repository
Tag, push and pull your image

Step 3: Join your hosts to a swarm

As a result of the previous steps, one of your host machines should have the nginx container image, and the rest of your hosts should have the Web server images, “web_1” and “web_2”. In this step, we’ll join the latter hosts to a swarm cluster.

Note: The host running the containerized NGINX load balancer cannot run on the same host as any container endpoints for which it is performing load balancing; the host with your nginx container image must be reserved for load balancing only. For more background on this, see Caveats and Gotchas below.

First, run the following command from any machine that you intend to use as a swarm host. The machine that you use to execute this command will become a manager node for your swarm cluster.

  • Replace with the public IP address of your host machine
C:\temp> docker swarm init --advertise-addr= --listen-addr :2377

Now run the following command from each of the other host machines that you intend to use as swarm nodes, joining them to the swarm as a worker nodes.

  • Replace with the public IP address of your host machine (i.e. the value of that you used to initialize the swarm from the manager node)
  • Replace with the worker join-token provided as output by the docker swarm init command (you can also obtain the join-token by running docker swarm join-token worker from the manager host)
C:\temp> docker swarm join --token :2377

Your nodes are now configured to form a swarm cluster! You can see the status of the nodes by running the following command from your manage node:

C:\temp> docker node ls

Step 4: Deploy services to your swarm

Note: Before moving on, stop and remove any NGINX or IIS containers running on your hosts. This will help avoid port conflicts when you define services. To do this, simply run the following commands for each container, replacing with the ID of the container you are stopping/removing:

C:\temp> docker stop 
C:\temp> docker rm 

Next, we’re going to use the “web_1” and “web_2” container images that we created in previous steps of this exercise to deploy two container services to our swarm cluster.

To create the services, run the following commands from your swarm manager node:

C:\ > docker
C:\ > docker service create --name=s2 --publish mode=host,target=80 --endpoint-mode dnsrr web_2 powershell -command {echo sleep; sleep 360000;}

You should now have two services running, s1 and s2. You can view their status by running the following command from your swarm manager node:

C:\ > docker service ls

Additionally, you can view information on the container instances that define a specific service with the following commands (where is replaced with the name of the service you are inspecting (for example, s1 or s2):

# List all services
C:\ > docker service ls
# List info for a specific service
C:\ > docker service ps 

(Optional) Scale your services

The commands in the previous step will deploy one container instance/replica for each service, s1 and s2. To scale the services to be backed by multiple replicas, run the following command:

C:\ > docker service scale =
# e.g. docker service scale s1=3

Step 5: Configure your NGINX load balancer

Now that services are running on your swarm, you can configure the NGINX load balancer to distribute traffic across the container instances for those services.

Of course, generally load balancers are used to balance traffic across instances of a single service, not multiple services. For the purpose of clarity, this example uses two services so that the function of the load balancer can be easily seen; because the two services are serving different HTML content, we’ll clearly see how the load balancer is distributing requests between them.

The nginx.conf file

First, the nginx.conf file for your load balancer must be configured with the IP addresses and service ports of your swarm nodes and services. An example nginx.conf file was included with the NGINX download that was used to create your nginx container image in step 1. For the purpose of this exercise, I copied and adapted the example file provided by NGINX and used it to create a simple template for you to adapt with your specific node/container information.

Download the nginx.conf file template that I prepared for this exercise from my personal GitHub repo, and save it onto your NGINX container host machine. In this step, we’ll adapt the template file and use it to replace the default nginx.conf file that was originally downloaded onto your NGINX container image.

You will need to adjust the file by adding the information for your hosts and container instances. The template nginx.conf file provided contains the following section:

upstream appcluster {
     server :;
     server :;
     server :;
     server :;
     server :;
     server :;
 }

To adapt the file for your configuration, you will need to adjust the : entries in the config file. You will have an entry for each container endpoint that defines your web services. For any given container endpoint, the value of will be the IP address of the container host upon which that container is running. The value of will be the port on the container host upon which the container endpoint has been published.

When the services, s1 and s2, were defined in the previous step of this exercise, the --publish mode=host,target=80 parameter was included. This paramater specified that the container instances for the services should be exposed via published ports on the container hosts. More specifically, by including --publish mode=host,target=80 in the service definitions, each service was configured to be exposed on port 80 of each of its container endpoints, as well as a set of automatically defined ports on the swarm hosts (i.e. one port for each container running on a given host).

First, identify the host IPs and published ports for your container endpoints

Before you can adjust your nginx.conf file, you must obtain the required information for the container endpoints that define your services. To do this, run the following commands (again, run these from your swarm manager node):

C:\ > docker service ps s1
C:\ > docker service ps s2

The above commands will return details on every container instance running for each of your services, across all of your swarm hosts.

  • One column of the output, the “ports” column, includes port information for each host of the form *:->80/tcp. The values of will be different for each container instance, as each container is published on its own host port.
  • Another column, the “node” column, will tell you which machine the container is running on. This is how you will identify the host IP information for each endpoint.

You now have the port information and node for each container endpoint. Next, use that information to populate the upstream field of your nginx.conf file; for each endpoint, add a server to the upstream field of the file, replacing the field with the IP address of each node (if you don’t have this, run ipconfig on each host machine to obtain it), and the field with the corresponding host port.

For example, if you have two swarm hosts (IP addresses 172.17.0.10 and 172.17.0.11), each running three containers your list of servers will end up looking something like this:

upstream appcluster {
     server 172.17.0.10:21858;
     server 172.17.0.11:64199;
     server 172.17.0.10:15463;
     server 172.17.0.11:56049;
     server 172.17.0.11:35953;
     server 172.17.0.10:47364;
}

Once you have changed your nginx.conf file, save it. Next, we’ll copy it from your host to the NGINX container image itself.

Replace the default nginx.conf file with your adjusted file

If your nginx container is not already running on its host, run it now:

C:\temp> docker run -it -p 80:80 nginx

Next, open a new cmdlet window and use the docker ps command to see that the container is running. Note its ID. The ID of your container is the value of in the next command.

Get the container’s IP address:

C:\temp> docker exec  ipconfig

With the container running, use the following command to replace the default nginx.conf file with the file that you just configured (run the following command from the directory in which you saved your adjusted version of the nginx.conf on the host machine):

C:\temp> docker cp nginx.conf :C:\nginx\nginx-1.10.3\conf

Now use the following command to reload the NGINX server running within your container:

C:\temp> docker exec  nginx.exe -s reload

Step 6: See your load balancer in action

Your load balancer should now be fully configured to distribute traffic across the various instances of your swarm services. To see it in action, open a browser and

  • If accessing from the NGINX host machine: Type the IP address of the nginx container running on the machine into the browser address bar. (This is the value of above).
  • If accessing from another host machine (with network access to the NGINX host machine): Type the IP address of the NGINX host machine into the browser address bar.

Once you’ve typed the applicable address into the browser address bar, press enter and wait for the web page to load. Once it loads, you should see one of the HTML pages that you created in step 2.

Now press refresh on the page. You may need to refresh more than once, but after just a few times you should see the other HTML page that you created in step 2.

If you continue refreshing, you will see the two different HTML pages that you used to define the services, web_1 and web_2, being accessed in a round-robin pattern (round-robin is the default load balancing strategy for NGINX, but there are others). The animated image below demonstrated the behavior that you should see.

As a reminder, below is the full configuration with all three nodes. When you’re refreshing your web page view, you’re repeatedly accessing the NGINX node, which is distributing your GET request to the container endpoints running on the swarm nodes. Each time you resend the request, the load balancer has the opportunity to route you to a different endpoint, resulting in your being served a different web page, depending on whether or not your request was routed to an S1 or S2 endpoint.

configuration_full

Caveats and gotchas

Is there a way to publish a single port for my service, so that I can load balance across just a few endpoints rather than all of my container instances?

Unfortunately, we do not yet support publishing a single port for a service on Windows. This feature is swarm mode’s routing mesh feature—a feature that allows you to publish ports for a service, so that that service is accessible to external resources via that port on every swarm node.

Routing mesh for swarm mode on Windows is not yet supported, but will be coming soon.

Why can’t I run my containerized load balancer on one of my swarm nodes?

Currently, there is a known bug on Windows, which prevents containers from accessing their hosts using localhost or even the host’s external IP address. This means containers cannot access their host’s exposed ports—the can only access exposed ports on other hosts.

In the context of this exercise, this means that the NGINX load balancer must be running on its own host, and never on the same host as any services that it needs to via exposed ports. Put another way, for the containerized NGINX load balancer to balance across the two web services defined in this exercise, s1 and s2, it cannot be running on a swarm node—if it were running on a swarm node, it would be unable to access any containers on that node via host exposed ports.

Of course, an additional caveat here is that containers do not need to be accessed via host exposed ports. It is also possible to access containers directly, using the container IP and published port. If this instead were done for this exercise, the NGINX load balancer would need to be configured to access:

  • containers that share its host by their container IP and port
  • containers that do not share its host by their host’s IP and exposed port

There is no problem with configuring the load balancer in this way, other than the added complexity that it introduces compared to simply putting the load balancer on its own machine, so that containers can be uniformly accessed via their hosts.

Options for CSS and JS Bundling and Minification with ASP.NET Core

$
0
0

Maria and I were updating the NerdDinner sample app (not done yet, but soon) and were looking at various ways to do bundling and minification of the JSS and CS. There's runtime bundling on ASP.NET 4.x but in recent years web developers have used tools like Grunt or Gulp to orchestrate a client-side build process to squish their assets. The key is to find a balance that gives you easy access to development versions of JS/CSS assets when at dev time, while making it "zero work" to put minified stuff into production. Additionally, some devs don't need the Grunt/Gulp/npm overhead while others absolutely do. So how do you find balance? Here's how it works.

I'm in Visual Studio 2017 and I go File | New Project | ASP.NET Core Web App. Bundling isn't on by default but the configuration you need IS included by default. It's just minutes to enable and it's quite nice.

In my Solution Explorer is a "bundleconfig.json" like this:

// Configure bundling and minification for the project.
// More info at https://go.microsoft.com/fwlink/?LinkId=808241
[
{
"outputFileName": "wwwroot/css/site.min.css",
// An array of relative input file paths. Globbing patterns supported
"inputFiles": [
"wwwroot/css/site.css"
]
},
{
"outputFileName": "wwwroot/js/site.min.js",
"inputFiles": [
"wwwroot/js/site.js"
],
// Optionally specify minification options
"minify": {
"enabled": true,
"renameLocals": true
},
// Optionally generate .map file
"sourceMap": false
}
]

Pretty simple. Ins and outs. At the top of the VS editor you'll see this yellow prompt. VS knows you're in a bundleconfig.json and in order to use it effectively in VS you grab a small extension. To be clear, it's NOT required. It just makes it easier. The source is at https://github.com/madskristensen/BundlerMinifier. Slip this UI section if you just want Build-time bundling.

BundleConfig.json

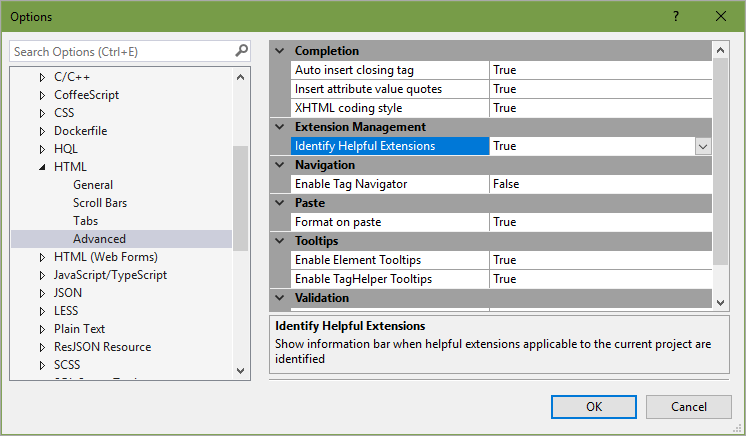
If getting a prompt like this bugs you, you can turn all prompting off here:

Tools Options HTML Advanced Identify Helpful Extensions

Look at your Solution Explorer. See under site.css and site.js? There are associated minified versions of those files. They aren't really "under" them. They are next to them on the disk, but this hierarchy is a nice way to see that they are associated, and that one generates the other.

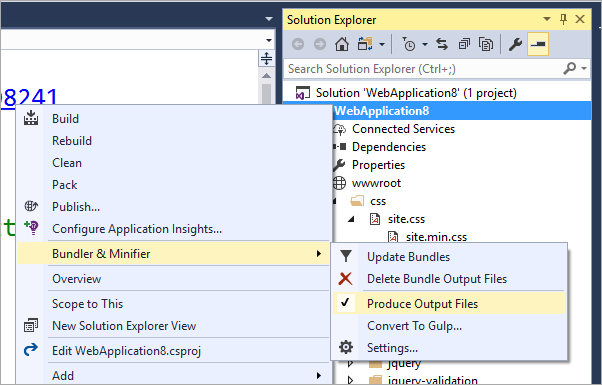
Right click on your project and you'll see this Bundler & Minifier menu:

Bundler and Minifier Menu

You can manually update your Bundles with this item as well as see settings and have bundling show up in the Task Runner Explorer.

Build Time Minification

The VSIX (VS extension) gives you the small menu and some UI hooks, but if you want to have your bundles updated at build time (useful if you don't use VS!) then you'll want to add a NuGet package called BuildBundlerMinifier.

You can add this NuGet package SEVERAL ways. Which is awesome.

  • Add it from the Manage NuGet Packages menu
  • Add it from the command line via "dotnet add package BuildBundlerMinifier"
    • Note that this adds it to your csproj without you having to edit it! It's like "nuget install" but adds references to projects!  The dotnet CLI is lovely.
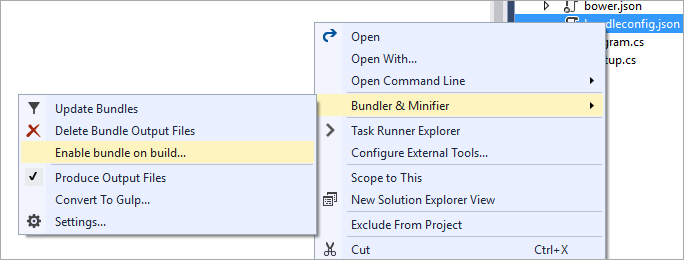
  • If you have the VSIX installed, just right-click the bundleconfig.json and click "Enable bundle on build..." and you'll get the NuGet package.
    Enable bundle on build

Now bundling will run on build...

c:\WebApplication8\WebApplication8>dotnet build
Microsoft (R) Build Engine version 15
Copyright (C) Microsoft Corporation. All rights reserved.

Bundler: Begin processing bundleconfig.json
Bundler: Done processing bundleconfig.json
WebApplication8 -> c:\WebApplication8\bin\Debug\netcoreapp1.1\WebApplication8.dll

Build succeeded.
0 Warning(s)
0 Error(s)

...even from the command line with "dotnet build." It's all integrated.

This is nice for VS Code or users of other editors. Here's how it would work entirely from the command prompt:

$ dotnet new mvc
$ dotnet add package BuildBundlerMinifier
$ dotnet restore
$ dotnet run

Advanced: Using Gulp to handle Bundling/Minifying

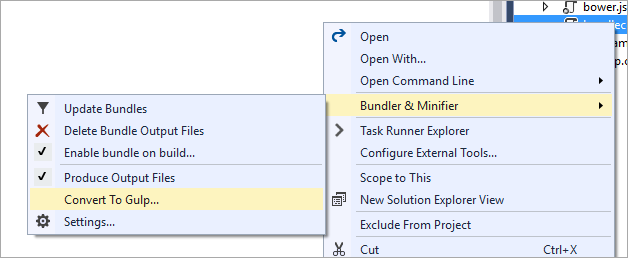
If you outgrow this bundler or just like Gulp, you can right click and Convert to Gulp!

Convert to Gulp

Now you'll get a gulpfile.js that uses the bundleconfig.json and you've got full control:

gulpfile.js

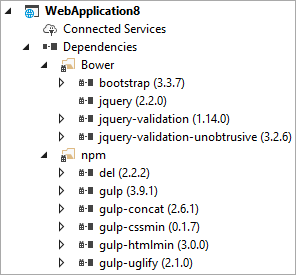
And during the conversion you'll get the npm packages you need to do the work automatically:

npm and bower

I've found this to be a good balance that can get quickly productive with a project that gets bundling without npm/node, but I can easily grow to a larger, more npm/bower/gulp-driven front-end developer-friendly app.


Sponsor: Did you know VSTS can integrate closely with Octopus Deploy? Join Damian Brady and Brian A. Randell as they show you how to automate deployments from VSTS to Octopus Deploy, and demo the new VSTS Octopus Deploy dashboard widget. Register now!


© 2017 Scott Hanselman. All rights reserved.
     

High CPU in monitoringhost.exe on Azure Virtual Machines (be careful what you wish for)

$
0
0

A customer recently told us as he was experiencing high CPU in two of Azure virtual machines that were operating as web servers. The process that was consuming the CPU was monitoringhost.exe, which is a child process of the Microsoft Monitoring Host service, our OpsMgr and Log Analytics Agent.

The job of this process is to do all the monitoring and data collection asked of it by the configuration of OpsMgr or Azure Log Analytics. I looked at what the process was up to and could see that it was busy running the following function

Microsoft_EnterpriseManagement_Mom_Modules_CloudFileUpload!Microsoft.EnterpriseManagement.Mom.Modules.CloudFileUpload.AsyncStreamHashCalculator.ReadStreamCallback

So, we were busy uploading a file to the workspace and calculating a hash on them in doing this.

Checking the process further. I could see we were uploading the following file.

C:\Program Files\Microsoft Monitoring Agent\Agent\Health Service State\Monitoring Host Temporary Files 319\45\W3SVC1-u_extend1.log.iislog

We were uploading an IIS log as you can easily ask Log Analytics to do for you.

Operations Management Suite settings

We checked these IIS log files on the affected servers and found that they were 14 and 15 GB in size!

They had been configured to never rollover as in the following screenshot.

Rollover settings for log files

Changing these to rollover on a schedule managed the size of the log files and returned CPU usage to normal levels.

So, the moral of the story is to be careful when you enable additional data to be sent to OMS/Log Analytics. Take some time to verify what you are asking the service to do, and what data is due to be uploaded.

Brian McDermott
Senior Escalation Engineer
Microsoft

An introduction to Azure Analysis Services on Microsoft Mechanics

$
0
0

Last year in October we released the preview of Azure Analysis Services, which is built on the proven analytics engine in Microsoft SQL Server Analysis Services. With Azure Analysis Services you can host semantic data models in the cloud. Users in your organization can then connect to your data models using tools like Excel, Power BI, and many others to create reports and perform ad-hoc data analysis.

I joined Jeremy Chapman on Microsoft Mechanics to discuss the benefits of Analysis Services in Azure.


Try the preview of Azure Analysis Services and learn about creating your first data model.

February 2017 Leaderboard of Database Systems contributors on MSDN

$
0
0

The Leaderboard initiative was started in October last year to recognize the top contributors on MSDN forums related to Database Systems. Many congratulations to the February 2017 top-10 contributors!

Machine generated alternative text:
All database systems 
February 2017 
Cloud databases* 
I st 
2nd 
3 rd 
4th 
5th 
6th 
7th 
8th 
9th 
10th 
Hilary Cotter 
Uri Dimant 
Olaf Helper 
Alberto Morillo 
philfactor 
Jingyang Li 
KevinNicholas 
Shanky 621 
Mailson Santana 
Dan Guzman 
February 2017 
1st 
2nd 
3 rd 
4th 
5th 
6th 
7th 
8th 
9th 
10th 
Albem Morillo 
Cloud Crusader 
Dan Guzman 
ernestochaves 
davidbaxterbrowne 
Loydon Mendonca 
AnonSSO 
Konstantin Zoryn 
Uri Dimant 
JRStern 
' MSDN forums related to Azure SQ_ Database, Azure SQL Data Warercuse. and Azure SQ_ Server Virtual Macrire

Hilary Cotter and Alberto Morillo top the Overall and Cloud database lists this month. The first 7 featured in last month’s Overall Top-10 as well.

The following continues to be the points hierarchy (in decreasing order of points):

Scoring methodology 
Database Systems. MSDN Contributors 
Answer 
not accepted 
Answer accepted 
o

For questions related to this leaderboard, please write to leaderboard-sql@microsoft.com

Azure SQL Data Warehouse now generally available in 27 regions worldwide

$
0
0

We are excited to announce the general availability of Azure SQL Data Warehouse in four additional regions—Germany Central, Germany Northeast, Korea Central, and Korea South. This takes the SQL Data Warehouse worldwide availability to 27 regions, more than any other major cloud provider.

SQL Data Warehouse is your go-to SQL-based fully managed, petabyte-scale cloud solution for data warehousing. SQL Data Warehouse is highly elastic, enabling you to provision in minutes and scale capacity in seconds. You can scale compute and storage independently, allowing you to burst compute for complex analytical workloads or scale down your warehouse for archival scenarios, and pay based off what you're using instead of being locked into predefined cluster configurations. Unlike other cloud data warehouse services, SQL Data Warehouse offers the unique option to pause compute, giving you even more freedom to better manage your cloud costs.

With general availability, SQL Data Warehouse offers an availability SLA of 99.9%, the only public cloud data warehouse service that offers an availability SLA to customers. Geo-Backups support has also been added to enable geo-resiliency of your data, allowing SQL Data Warehouse Geo-Backup to be restored to any region in Azure. With this feature enabled, backups are available even in the case of a region-wide failure, keeping your data safe. Learn more about the capabilities and features on SQL Data Warehouse with general availability.

Get started with SQL Data Warehouse today and experience the speed, scale, elasticity, security, and ease of use of a cloud-based data warehouse for yourself.

Azure SQL Data Warehouse is generally available across the following regions:

North Europe, North Central US, Central US, East US, East US 2, South Central US, West Central US, West US, West US 2, Canada Central, Canada East, West Europe, Germany Central, Germany Northeast, East Asia, Southeast Asia, Australia Southeast, Central India, South India, China East, China North, Japan East, and Brazil South.

Germany Central, Germany Northeast, Korea Central, Korea South, North Europe, Japan East, Brazil South, Australia Southeast, Central US, East US, East US 2, South Central US, West Central US, West US, West US 2, West Europe, East Asia, Southeast Asia, Central India, South India, Canada Central, and Canada East.

Learn more about Azure services availability across regions.

Learn more

Check out the many resources for learning more about SQL Data Warehouse:

What is Azure SQL Data Warehouse?

SQL Data Warehouse best practices

Videos

MSDN forum

Stack Overflow forum


Data Simulator For Machine Learning

$
0
0

Virtually any data science experiment that uses a new machine learning algorithm requires testing across different scenarios. Simulated data allows one to do this in a controlled and systematic way that is usually not possible with real data.

A convenient way to implement and re-use data simulation in Azure Machine Learning (AML) Studio is through a custom R module. Custom R modules combine the convenience of having an R script packaged inside a drag and drop module, with the flexibility of custom code where the user has the freedom of adding and removing functionality parameters, seen as module inputs in the AML Studio GUI, as needed. A custom R module has identical behavior to native AML Studio modules. Its input and output can be connected to other modules or be set manually, and they can process data of arbitrary schema, if the underlying R code allows it, inside AML experiments. An added benefit is that they provide a convenient way of deploying code without revealing the source, which may be convenient for IP sensitive scenarios. By publishing it in Cortana Intelligence Gallery one can easily expose to the world any algorithm functionality without worrying about classical software deployment process.

Data simulator

We present here an AML Studio custom R module implementation of a data simulator for binary classification. Current version is simple enough to have the complete code inside Cortana Intelligence Gallery item page. It allows one to generate custom feature dimensionality datasets with both label relevant and irrelevant columns. Relevant features are univariately correlated with the label column. Correlation directionality (i.e. positive or negative correlation coefficient) is controlled by correlationDirectionality parameter(s). All features are generated using separate runif calls. In the future, the module functionality can be further extended to allow the user to choose other distributions by adding and exposing ellipsis/three dots argument feature in R. Last module parameter (seedValue) can be used to control results reproducibility. Figure 1 shows all module parameters exposed in AML Studio.

image 

Figure 1. Data Simulator Custom R module in an AML Experiment. 1000000 samples are simulated, with 1000 irrelevant and 10 label relevant columns. Data is highly imbalanced since only 20 samples are of “FALSE” class. 2 values (.03 and 5) long array value for the “noiseAmplitude” property is reused for all relevant columns. Similarly, the sign of the 4 values (1, -1, 0, 3.5) “label-features correlation” property is reused for all 10 relevant columns to control the correlation directionality (i.e. positive or negative) with the label column.​

By visualizing, as shown below in Figure 2, the module output (right click and then “Visualize”), we can check basic properties of the data. This includes data matrix size and univariate statistics like range and missing values.

image 

Figure 2. Visualization of simulated data. Data has 1,000,000 rows and 1011 columns (10 relevant and 1000 irrelevant feature columns, plus label). Histogram of the label column (right graph) indicate large class imbalance chosen for this simulation.​

Univariate Feature Importance Analysis of simulated data

Note: Depending on the size chosen for simulated data, it may take some time to generate them: e.g. 1 hour for a 1e6 rows x 2000 feature columns (2001 total columns) dataset. However, new modules can be added to the experiment even after data were generated, and the cashed data can be processed as described below without having to simulate them again.

Univariate Feature Importance Analysis (FIA) measures similarity between each feature column and label values using metrics like Pearsonian Correlation and Mutual Information (MI). MI is more generic than Pearsonian Correlation since it has the nice property that it does not depend of directionality of data dependence: a feature that has labels of one class (say “TRUE”) for all middle values, and the other class (“FALSE”) for all small and large values will still have a large MI value although its Pearsonian Correlation may be close to zero.

Although feature-wise univariate FIA does not capture multivariate dependencies, it provides a simple to understand picture of the relationship between features and classification target (labels). An easy way to perform univariate FIA in AML Studio is by employing existing AML module for Filter Based Feature Selection for similarity computation and Execute R Script module(s) for results concatenation. To do this, we extend the default experiment deployed though CIS gallery page by adding several AML Studio modules as described below.

We first add a second Filter Based Feature Selection module, and we choose Mutual Information value for its “Feature scoring method” property. The original Filter Based Feature Selection module, with “Feature scoring method” property set to Pearson Correlation should be left unchanged. For both Filter Based Feature Selection modules, the setting for “Number of desired features” property is irrelevant. since we will use the similarity metrics computed for all data columns, available by connecting to the second (right) output of each Filter Based Feature Selection module. The “Target column” property for both modules needs to point to the label column name in the data. Figure 3 shows the settings chosen for the second Filter Based Feature Selection module.

clip_image006[4]

Figure 3. Property settings for the Filter Based Feature Selection AML Studio module added for Mutual Information computation. By connecting to the right side output of the module we get the MI values for all data columns (features and label).​

The next two Execute R Script module(s) added to the experiment are used for results concatenation. Their scripts are listed below.

First module (rbind with different column order):

  dataset1 <- maml.mapInputPort(1) # class: data.frame
  dataset2 <- maml.mapInputPort(2) # class: data.frame

  dataset2 <- dataset2[,colnames(dataset1)]
  data.set = rbind(dataset1, dataset2)

  maml.mapOutputPort("data.set")

Second module (add row names):

  dataset <- maml.mapInputPort(1) # class: data.frame

  myRowNames <- c("PearsCorrel", "MI")
  data.set <- cbind(myRowNames, dataset)
  names(data.set)[1] <- c("Algorithms")

  maml.mapOutputPort("data.set")

The last module, Convert to CSV, added to experiment allows one to download the results in a convenient format (csv) if needed. The results file is in plain text and can be opened in any text editor or Excel (Figure 4):

clip_image008

Figure 4. Downloaded results file visualized in Excel.

Simulated data properties

FIA results for relevant columns are shown in Figure 5. Although MI and Pearsonian correlation are on different scales, both similarity metrics are well correlated. They are also in sync with the “noiseAmplitude” property of the custom R module described in Figure 1. The 2 noiseAmplitude values (.03 and 5) are reused for all 10 relevant columns, such that relevant features 1, 3, 5, 7, and 9 are much better correlated with the labels dues to their lower noise amplitude.

clip_image010

Figure 5. FIA results for the 10 relevant features simulated before. Although MI (left axis) and Pearsonian correlation (right axis) are on different scales, both similarity metrics are well correlated.​

As expected, for each of the 1000 irrelevant features columns, min, max and average statistics for both MI and Pearsonian Correlation are below 1e-2 (see Table 1).


PearsCorrel

MI

min

9.48E-07

3.23E-07

max

3.93E-03

8.31E-06

average

7.67E-04

3.02E-06

stdev

5.84E-04

1.27E-06

Table 1. Statistics of similarity metrics for the 1000 irrelevant columns simulated above.

This result is heavily dependent on sample size (i.e. number of simulated rows). For significantly smaller row sizes than 1e3 used here, the max and average MI and Pearsonian Correlation values for irrelevant columns may be larger due to the probabilistic nature of simulated data.

Conclusion

Data simulation is an important tool for understanding ML algorithms. The Custom R module presented here is available in Cortana Intelligence Gallery and its results can be analyzed using AML module for Filter Based Feature Selection. Future extension of the algorithm should include regression data and multivariate dependencies.

Tax-themed phishing and malware attacks proliferate during the tax filing season

$
0
0

Tax-themed scams and social engineering attacks are as certain as (death or) tax itself. Every year we see these attacks, and 2017 is no different.

These attacks circulate year-round as cybercriminals take advantage of the different country and region tax schedules, but they peak in the months leading to U.S. Tax Day in mid-April.

Cybercriminals are using a variety of social engineering tactics related to different scenarios associated with tax filing, in order to get you to click links or open malicious attachments.

Here are some recent examples we’ve seen. The best defense is awareness: no matter what stage you are in your tax filing and wherever you are in the world, don’t fall for these social engineering attacks.

Tax refund: “You are eligible!”

An enticing bait attackers use says that you’re eligible for a refund. We’re seeing several phishing campaigns targeting taxpayers in the United Kingdom, where tax filing season ended in January. These attacks are targeting people who might be waiting for information about their tax refund.

These kinds of phishing emails pretend to come from HM Revenue and Customs, the tax collection body in the UK. These mails vary in how legitimate they appear, but in all cases the attackers want you to click a link in the mail. The link points to a phishing page that will ask for sensitive information.

tax-social-engineering-email-malware-4

tax-social-engineering-email-malware-5

tax-social-engineering-email-malware-6

If your default browser is Microsoft Edge, Microsoft SmartScreen will automatically block access to these phishing sites. Internet Explorer also includes Microsoft SmartScreen.

tax-social-engineering-email-malware-smartscreen

Tax filed: “Payment has been debited from your account”

Another cybercriminal tactic is to pretend to deliver a receipt for taxes filed. A recent example is a malicious email with the subject “Rs. 73,250 TDS Payment Has Been Debited from your Account”. TDS refers to Tax Deducted at Source, which is the method of collecting tax in India.

The message body says, “Kindly download and view your receipt below attached to this email.” The attachment plays the part and bears the name Income Tax Receipt.zip.

tax-social-engineering-email-malware-3

Inside the .zip is the file Income Tax Receipt.scr, which is really a banking Trojan detected by Windows Defender Antivirus as TrojanSpy:Win32/Bancos.XN.

The payload Trojan is part of a family of keyloggers. When it runs, it logs all keystrokes and sends these to an attacker. From the keystrokes, an attacker can then collect sensitive info like user names and passwords for online banking, email, social media, and other online accounts.

SHA1: 89c5248a989c79fdff943c7c896aeaee4175730d

Tax overdue: “Info on your debt and overdue payments”

Some tactics are more threatening. One example accuses the recipient of having overdue tax.

This threat can cause the recipient to panic and click a link in the email without thinking things through. We monitored an attack that targets taxpayers in the US and accused recipients of overdue tax and that action needed to be taken immediately. The link in the email is, of course, a phishing page.

tax-social-engineering-email-malware-7

Again, Microsoft SmartScreen blocks access to this phishing page.

Tax evasion: “Subpoena from IRS”

Some attacks use fear as bait. One such bait tells recipients that there’s pending law enforcement action against them. We saw an example of this sent to U.S. taxpayers. It pretends to contain information about a subpoena, asking “What should we do regarding the subpoena from IRS?”

tax-social-engineering-email-malware-8

The attachment is a document file that Microsoft Word opens in Protected View. The attackers expected this, so the document contains an instruction to Enable Editing.

tax-social-engineering-email-malware-9

If Enable Editing is clicked, malicious macros in the document download a malware detected as TrojanDownloader:Win32/Zdowbot.C.

Zdowbot is a family of Trojan downloaders. They connect to a remote host and wait for commands. In addition to downloading and installing other malware, they can send information about your PC to a remote attacker.

SHA1:7a46f903850e719420ee19dd189418467cb8af40

Tax preparation: “I need a CPA”

Some attacks are relevant during the early part of the tax filing process. We saw an attack this year that targets accountants in the U.S., given the timing and the information in the email referencing the IRS.

The attack pretends to be coming from somebody seeking the services of a CPA. It includes an attachment named tax-infor.doc.

tax-social-engineering-email-malware-1

The attachment is a document with malicious macro code. Macros should be disabled by default (as is the best practice). When the attachment opens, Microsoft Word issues a warning. To encourage you to enable macros, the document displays a fake message box that says “Please enable Editing and Content to see this document”. The fake message box is designed to look like it’s part of Microsoft Word, but it’s really part of the document itself.

tax-social-engineering-email-malware-2

If you fall for the ruse and enable macros, then the malicious macro downloads the malware TrojanSpy:MSIL/Omaneat from hxxp://193[.]150[.]13[.]140/1.exe.

Omaneat is a family of info-stealing malware. These threats can log keystrokes, monitor the applications you open, and track your web browsing history.

SHA1: ffc06b87eed545df632b61b2a32ef36216eb697d

How to stay safe from social engineering attacks

Tax-themed malware and phishing attacks highlight an important truth: most cybercrime is after your hard-earned money.

But these attacks rely on social engineering tactics — you can detect them if you know what to look for. Be aware, be savvy, and be cautious in opening suspicious emails. Even if the emails came from someone you know, be wary about opening the attachment or click on links. Some malicious emails may be spoofing the sender.

The built-in security technologies in Windows 10 can help protect you from these attacks. Keep your computers up-to-date.

Enable Windows Defender Antivirus to detect malware that arrive via email messages using tax filing as bait. Windows Defender Antivirus uses cloud-based protection, helping to protect you from the latest threats.

Practice safe browsing habits. We recommend Microsoft Edge. It blocks known phishing and other malicious sites using Microsoft SmartScreen.

Additional protection is available for businesses running Windows 10 and Office products.

Use Office 365 Advanced Threat Protection, which has machine learning capability that blocks dangerous email threats, such as social engineering emails that carry malware or phishing links.

Use Device Guard to lock down devices and provide kernel-level virtualization-based security, allowing only trusted applications to run.

IT administrators can use Group Policy in Office 2016 to block known malicious macros, such as the documents used in these social engineering attacks, from running.

For more information, download and read this Microsoft e-book on preventing social engineering attacks, especially in enterprise environments.


Jeong Mun and Francis Tan Seng

MMPC

Improving patient health through collaboration, innovation and efficiency with Office 365

$
0
0

Today’s Microsoft Office 365 post was written by Dennis Giles, director of Unified Communications for Advocate Health Care.

Traditionally, hospitals concentrated on taking care of patients while they were within the walls of the building. Today, there’s a new model for healthcare, one in which hospitals and healthcare systems look beyond the facility itself, helping patients avoid hospital stays and ensuring the best possible long-term outcomes. That new model requires a new way of thinking about patients and how a healthcare system operates to most efficiently care for them.

As one of Illinois’s largest hospital systems, Advocate Health Care faces special challenges. We aim for excellence in all that we do, but providing the same high level of service across our entire organization of 37,000 associates is no small task. We decided to enhance our ability to share best practices and promote teamwork among our facilities by giving all employees underlying technology to support those collaboration goals. In our case, that technology comes in the form of Microsoft Office 365, which we embraced as early adopters when it launched more than five years ago.

We recently participated in a total economic impact analysis of our Office 365 adoption. Conducted by Forrester, the analysis revealed through multiple metrics that the move to Office 365 has been a truly transformative one for us. We’re reaping financial benefits such as a three-year, risk-adjusted return on investment of 63 percent* from our Office 365 subscription, saving U.S. $53.8 million† from our information worker productivity gains alone. For example, the Forrester analysis found that we’re saving $2.2 million over three years† in time and transportation costs, because our information workers now have effective collaboration tools they use to minimize the need for travel.

By making it easier to work together, we’ve increased efficiency throughout our system. In fact, the Forrester analysis shows that we’re saving two million worker hours over three years,* which has an incredible impact on productivity. We’ve also minimized the amount of time that our clinical staff spend traveling to see patients, whether that’s moving from hospital to hospital or from floor to floor. For example, we established an electronic Intensive Care Unit (ICU) in the early 2000s, and this solution now utilizes video calls with Skype for Business Online to provide multidisciplinary rounds for some of our hospitals’ ICUs. Centralized physicians monitor patients using video and onscreen vital signs, and multidisciplinary rounds take place by moving a wheeled workstation around each ICU so that all the caregivers involved can coordinate the patient’s care—without traveling from one hospital to another. Conducting those rounds using video, rather than just a voice call, has made a tremendous difference. It’s now a more personalized experience, with greater interaction among everyone involved.

That same mobile communication capability comes in handy when we transfer patients from a hospital’s emergency department into another unit. All patient moves require that nurses convey critical information to the receiving department, and previously, our nurses would need to leave the floor to collect patients from the emergency department. Today, they receive handoff information from anywhere, which means they can stay where they’re needed, and a patient transport associate makes the patient transfer.

We’re continuing to expand our adoption of Office 365 functionality. A few years back, we established a system that nurses use to follow up on patients’ visits and make sure that each patient’s transition from hospital to home goes smoothly. Now, we’re taking it to the next level with a pilot program aimed at longer-term follow-up with high-risk patients, such as those with chronic conditions. Nurses use our Patient Experience System, which takes advantage of Microsoft SharePoint technology, to make regular contact with discharged high-risk patients. Every nurse in the program has access to the system’s shared information and insights. This helps them make sure the patients are staying healthy and receiving the follow-on services that they need to avoid re-admittance. Ultimately, we’ll be able to track areas in which those patients have trouble managing their health so that we can proactively find even better ways to serve them.

We’re also breaking down the barriers between our facilities and sharing best practices across Advocate Health Care. In the past, we used shared network drives, but necessary firewalls presented roadblocks. Today, we use multiple Office 365 components to collaborate on documents and access a single source of the truth. Employees help each other answer questions about everything from finding benefits information to hand-washing protocols. Together, we look for successes and promote them throughout the organization.

Adopting Office 365 has helped us improve security and compliance with a wide range of policies as well. For example, we deployed Office 365 Advanced Threat Protection (ATP) to all 37,000 members of our workforce to safeguard our email environment against potential threats. With ATP, we’re better protected against zero-day malware attacks, because associates can only access links and email attachments that have been identified as not malicious.

We moved our intranet onto SharePoint Online and save $400,000 in infrastructure every four years,‡ plus annual maintenance cost savings. Our 128 content owners formed a Yammer group to train themselves how to interact with the new intranet, sharing knowledge and gaining expertise with minimal IT department involvement.

And we’re just scratching the surface. We’re excited to dig into Microsoft Power BI to gain intelligence from our data and refine our clinical procedures. We already use it to track the demand for our language carts, which provide web-based translation services for non-English-speaking patients. Because we can see how we’re using those carts and where they’re needed most, we can improve that service to our patients.

We also look forward to exploring MyAnalytics for a greater understanding of how we work in our individual roles. We’re confident that we’ll continue to derive additional value from Office 365 as we take advantage of more and more functionality.

We are using Office 365 to raise the standard of care at Advocate Health Care, transforming from a system of hospitals into a true hospital system in which we work collaboratively to positively influence patient health and safety. Having a set of capabilities like Office 365 that helps us support collaboration, foster efficiency and bring insights to life has been essential in getting us to where we are today.

—Dennis Giles

Read the full commissioned study conducted by Forrester Consulting, “Business Value Realization with Office 365: A Total Economic Impact Analysis of Microsoft Office 365.”

Notes

*Business Value Realization with Office 365: A Total Economic Impact Analysis of Microsoft Office 365,” Forrester Research, Inc., March 2017, page 3
†Business Value Realization with Office 365: A Total Economic Impact Analysis of Microsoft Office 365,” Forrester Research, Inc., March 2017, page 4
‡Business Value Realization with Office 365: A Total Economic Impact Analysis of Microsoft Office 365,” Forrester Research, Inc., March 2017, page 15

The post Improving patient health through collaboration, innovation and efficiency with
Office 365
appeared first on Office Blogs.

New reasons to make Microsoft Bookings the go-to scheduling software for your business

$
0
0

Last year, we released Microsoft Bookings to customers in the U.S. and Canada, introducing an easy way for small businesses to schedule and manage appointments with their customers. Today, we are pleased to announce that we’re beginning to roll out the service to Office 365 Business Premium subscribers worldwide. Based on your feedback, we are bringing several new features to Bookings:

  • Add your Office 365 calendar to Bookings—Connect your Office 365 calendar to Bookings, so that the times you are busy will automatically be blocked in your public Booking page.
  • Add buffer time before and after your appointments—Do you need prep time before or after an appointment? Adding buffer time to a service automatically blocks that time in your Booking page too.
  • Bookings apps for your iOS and Android phone—Now you can book an appointment, contact a customer or check a staff member’s appointments while away from the office.
  • Customize your Booking page—We added more color customization options, so you can better personalize your Booking page.

These new capabilities will start showing up automatically in Bookings in the coming weeks. Let’s take a detailed look at what’s new.

Add your Office 365 calendar to Bookings

One of the top pieces of feedback we’ve heard is that you want to be able to add events from your Office 365 calendar to Bookings. So, we added integration between these calendars to help you avoid booking customer meetings during the time you’ve set aside for personal appointments, staff and partner meetings or other aspects of running your business.

To add Office 365 calendars to Bookings, click the Staff tab on the left navigation panel. On the Staff details page, select the Events on Office 365 calendar affect availability checkbox.

Add Office 365 calendar events to Bookings.

Once you activate this option, the system automatically blocks busy times on the Bookings calendar and on the self-service Booking page your customers see, so that you won’t get double-booked. Similarly, so your staff doesn’t get double-booked, you can also add their Office 365 calendars.

Add buffer time between appointments

Some services can be provided through back-to-back appointments. But another top piece of feedback you gave us was that many of your services require travel, prep and/or set-up time beforehand, and clean-up and travel time once the service was delivered. For customers with these needs, we added buffer times to give you more options to customize the services you deliver.

To add buffer times, click the Services tab in the left navigation column and either edit a current service or create a new one. Turn on the toggle below the Buffer time your customers can’t book and you will get buffer time selections that can be applied before and after the service appointment. These are times your customers can’t book an appointment with you before and after an appointment.

You can turn on the “buffer time” option in the Services tab.

Apps for iOS and Android

We know it’s essential for you to keep up with your business while you are away from a desk, so we built mobile apps that let you manage your bookings and staff, or access your customer list while you’re on the go.

After you download the Bookings app on iOS and Android, you can use your phone to:

  • View and manage your Bookings calendar.
  • Create and edit bookings.
  • See real-time availability and whereabouts of your staff.
  • Respond to customers with bookings quickly and easily.
  • Get directions to your next booking.
  • Access your customer list.

Customize your Booking page

Your Booking page should look and feel like an extension of your business, and it needs to positively reflect your brand.

To help you achieve this, we added options to customize it. For example, you can choose your main color for your Booking page from a color palette, and choose whether you’d like to show your business logo.

To customize your page, click Booking page in the left navigation list and select the color you want. If you don’t want your logo to be displayed, uncheck the Display your business logo on your booking page checkbox. Once you are done, simply click Save and publish.

Use the Booking page tab to customize your Booking page. Remember to click Save and publish to keep your changes.

How to get started with Bookings

Bookings is included in all Office 365 Business Premium subscriptions, and getting started is easy. To simplify the work of customer scheduling for your business, just sign in to Office 365 and click the Bookings tile on the App Launcher. If you don’t see the Bookings tile, we may still be in the process of rolling out the service in your region—so check back a bit later. If you need more help, the article “Say hello to Microsoft Bookings” provides a quick overview of how to use Bookings.

Once you are signed in to Office 365 you can find the App Launcher on the top left corner.

Bookings is designed to delight your customers, simplify scheduling and free time for you to be on top of your business wherever you are. Your feedback has been extremely useful; please keep it coming by clicking the feedback links found on the Bookings home page.

—The Bookings team


Frequently asked questions

Q. Why can’t I see Bookings?

A. We are actively rolling out Bookings in all regions and it may take a few weeks for the updates to reach every customer. If you are already signed in to your Office 365 web experience, please try signing out and back in.

Q. Why can’t I see new features mentioned here, like Office 365 calendar integration and buffer time?

A. We are activating these new capabilities for all Bookings users, but the rollout will take a week or two to complete.

Q. Will someone outside of my company see my schedule and meetings?

A. No. Bookings will only use your Office 365 calendar free/busy information to block that time so you won’t be double-booked.

Q. I use Facebook as my business’s webpage. Can I use Bookings?

A. Yes. In October, we announced how to connect Microsoft Bookings to your Facebook page and grow your business.

Q. How do I learn more about the new features?

A. Our Microsoft Bookings support page has more details about Bookings.

Q. Will Bookings be available for Enterprise customers (E3 and E5)?

A. We intend to bring Bookings to E3 and E5 customers in the future.

Q. Where do I download the Bookings app?

A. The Bookings app for iOS is available in the App Store. The Bookings app for Android is available in Google Play in the U.S. and Canada, and will be rolling out worldwide in the next couple of weeks.

The post New reasons to make Microsoft Bookings the go-to scheduling software for your business appeared first on Office Blogs.

Outlook 2016 for Mac adds Touch Bar support and now comes with your favorite apps

$
0
0

Last week, Outlook for Mac released two highly requested features designed to help you get more done, quickly. First, we added support for the Touch Bar for MacBook Pro users. Through the Touch Bar, we intelligently put the most common inbox, formatting and view commands at your fingertips—all based on what you’re doing in Outlook.

Additionally, we’re bringing your favorite apps to your inbox with add-ins for Outlook for Mac. Whether it’s translating emails on the fly or updating your notes or project board, you will now be able to accomplish all this and more right from your inbox. These add-ins are also available across Outlook for Windows, iOS and the web, so your favorite apps are always there to help you accomplish tasks quickly.

Here’s a look at what’s new!

Intuitive commands at your fingertips with Touch Bar support in Outlook for Mac

The Touch Bar in Outlook intelligently provides quick access to the most commonly used commands as you work on email and manage your calendar. When composing a new mail or meeting request, the Touch Bar displays the common formatting options. When viewing your calendar, you can switch between different views. And when viewing the reminders window, you can join an online meeting with one tap on the Touch Bar.

Support for Touch Bar in Outlook for Mac is available to all Office 365 subscribers, as well as all Office 2016 for Mac customers.

Accomplish tasks quickly with new add-ins

Add-ins bring your favorite apps right inside Outlook, so you can accomplish tasks quickly without needing to switch back and forth between email and other apps. Last year, we announced the rollout of add-ins to Outlook 2016 for Mac in Office Insider. We are now making add-ins available to all Outlook 2016 for Mac customers who have Exchange 2013 Service Pack 1 or higher, or Office 365 or Outlook.com mailboxes. Use these add-ins to translate emails on the fly, edit a record in your CRM system, update your notes or project board, or set up a meeting over coffee and more—all without leaving Outlook. Outlook for Mac customers can take advantage of all Outlook add-ins available in the Office store, including:

  • Get business intelligence and track emails quickly with the Dynamics 365 add-in. Use the Nimble add-in to get real-time insights about your Outlook contacts.
  • Collaborate effortlessly with your coworkers using add-ins from Evernote, Trello, Microsoft Translator, Smartsheet and Citrix ShareFile (coming soon).
  • Add email reminders and schedule emails with the Boomerang add-in for Outlook.
  • Say thanks to your friends and co-workers by giving them the gift of Starbucks through the Starbucks for Outlook add-in.
  • Make emails more fun and visually expressive with GIPHY, when words aren’t enough.

To start using add-ins, just click the Store icon on the Outlook ribbon to open the Office Store. Next, search for the add-in you are looking for and turn its toggle to On. You will then see the add-in command appear in your inbox and can start using it. You just need to install add-ins once and they will be available for use across Outlook on the web, Windows, Mac and iOS.


Want to bring your apps to Outlook? If you are a developer looking to build add-ins for Outlook, check out dev.outlook.com for more resources.

Got a suggestion for how to improve Outlook for Mac? Please suggest and vote on future feature ideas on our Outlook for Mac UserVoice page.

—The Outlook team

The post Outlook 2016 for Mac adds Touch Bar support and now comes with your favorite apps appeared first on Office Blogs.

Viewing all 13502 articles
Browse latest View live


<script src="https://jsc.adskeeper.com/r/s/rssing.com.1596347.js" async> </script>