Quantcast
Channel: TechNet Technology News
Viewing all 13502 articles
Browse latest View live

Optimize your productivity with .NET in Visual Studio 2017

$
0
0

Visual Studio 2017 makes you more productive by getting you to your code fast and helping you write code quickly. With improvements to performance, navigation, and debugging as well as the additions of new refactorings, code style configuration/enforcement, and live unit testing, this release is chock full of advancements. This post shows you how to take full advantage of these features.

Getting Started

Visual Studio 2017 significantly cuts down the time it takes to install, open Visual Studio, and write code in your solution. The new Visual Studio installer gives you the freedom to pick and choose exactly what you want installed.

After you install Visual Studio, you’ll notice how much faster the VS startup time and solution load time are:

  • The improvements made on Visual Studio startup time are illustrated in this blog post featuring a side-by-side video comparison.
  • You can enable lightweight solution load to lazily load projects. This is especially helpful if you work on a solution with hundreds of projects but you personally only work in one or two of those. You can enable lightweight solution load by going to Tools > Options > Projects and Solutions > Lightweight solution load for all solutions. Note: lightweight solution load does not work with F# projects.

Navigating Your Codebase

Visual Studio 2017 refreshes the navigation experience to help you get from A to B with greater confidence and fewer distractions:

  • Go To Implementation (Ctrl+F12) – navigate from any base type or member to its various implementations.
  • Go To All (Ctrl+T or Ctrl+,) – navigate directly to any file/type/member/symbol declaration. You can use the icons along the top of the feature to filter your result list or use the query syntax (e.g., “f searchTerm” for files, “t searchTerm” for types, etc.).
  • Find All References (Shift+F12) – now with syntax colorization, Find All Reference results can be custom grouped by a combination of project, definition, and path. You can also “lock” results so that you can continue to find other references without losing your original results.
  • Indent Guides ­– dotted, gray vertical lines act as landmarks in code to provide context within your frame of view. You may recognize these from the popular Productivity Power Tools.

gotoall

Writing Your Code

In this release, we have made a bunch of small tweaks and additions to help automate common tasks and speed up your workflow:

  • IntelliSense– filter your completion list by category by clicking on the icons in the tray or by hovering over them to learn the keyboard shortcut. This is great when you are learning a complex API or working in WPF and specifically looking for only properties or events, etc.
  • Refactorings – use ‘Ctrl+.’ to access all the refactorings and quick actions we’ve added in VS. Here is an overview:
    • Move type to file with same name
    • Sync file and type name
    • Add missing switch/Select case
    • Make method synchronous
    • Convert method to property, and vice versa
    • Convert to interpolated string
    • And many more!
  • Add using/Imports for types in reference assemblies/NuGet packages– if you type an unrecognized type, we will search for it in your reference assemblies and on NuGet.org and offer a quick fix to add the using/Imports. This feature is off by default; to enable it go to Tools > Options > Text Editor > [C#/Basic] > Advanced > Suggest usings for types in reference assemblies and Suggest usings for types in NuGet packages. Enabling the latter option will download 10 MB of a NuGet index on your machine and it will take several seconds to complete (this will not affect your workflow in VS, but it does means you cannot immediately use the feature once enabling it).
  • Code Suggestions – code suggestions let you hint best practices to developers. They surface in the editor as gray dots and you can apply suggestions with the command “Ctrl+.”.

intellisensefiltering

Driving Consistency and Readability

In Visual Studio 2017, you can configure and enforce your team’s coding conventions to drive consistency across your entire repository with EditorConfig. EditorConfig is an open file format and we worked with their community to support .NET code style within this format. Teams can configure convention preferences and choose how they are enforced inside the editor (as suggestions, warnings, or errors). The rules apply to whatever files are in the directory that contains the EditorConfig file. If you have different conventions for different projects, you can define each project’s rules in different EditorConfig files if the projects are in separate directories. Because, at the end of the day, EditorConfig is just a text file, it’s easy to check it into source control and have it live and travel with your source.

If you do not wish to use an EditorConfig file or you want to configure rules that your team hasn’t explicitly set, go to Tools>Options>Text Edtior> [C#/Basic]>Code Style to configure your machine local settings.

To get language service support when editing an EditorConfig file in VS, download Mads Kristensen’s extension. Learn more about coding convention support in VS2017 by reading our documentation or our post on the .NET blog.

Testing Your Code

Live Unit Testing reveals the impact of a code change on your unit tests almost instantly without you having to shuffle between the editor and the Test Explorer to manually run your tests. The icons on each line of code illustrate whether the line is hit by all passing tests (green check), at least one failing test (red ex), or if it is not covered by any tests (blue dash). To enable Live Unit Testing for your solution, go to Test > Live Unit Testing > Start.

For those of you with large solutions, we enable you to select which tests you want to be “live”. From the Solution Explorer, you can right-click on a project to Include/Exclude it from the Live Test Set or if you are within a test file, you can highlight a group of tests and right-click to Include/Exclude them. You can play with other settings for Live Unit Testing by going to Tools > Options > Live Unit Testing.

To learn more about Live Unit Testing and how it can save you time and effort, read this blog post.

lut

Debugging

Visual Studio 2017 builds upon the debugging experience to help you identify the source of an issue faster:

  • The new Exception Helper puts the most important information from an exception at the top-level, like inner exception details and the expression that returns null. From the Exception Helper you can also choose to disregard certain exception types while debugging—such as exceptions thrown by third-party libraries.
  • Run To Click executes a developer’s program until it reaches the target line of code and breaks in debug mode. This feature saves you time by acting as a temporary breakpoint.
  • XAML Edit and Continue lets you change your XAML while your app is running so that you can continuously tweak your UI. Note: this feature was originally added in Visual Studio 2015 Update 2.
  • Reattach To Process enables you to quickly reattach to previous debug targets. After you have manually attached once, you don’t have to waste time in the Attach to Process dialog to debug that same application. You can find this feature under Debug > Reattach to process… or with the command “Shift+Alt+P”.

exceptionhelper

Moving Your Code Forward with C# 7.0 and VB 15

The release of Visual Studio 2017 coincides with the final versions of C# 7.0 and VB 15. The new language features in these releases help you work with data and write more condensed code.

When adopting these new features into your everyday development, note:

  • To use tuples in C# and Visual Basic you must have the ValueTuple package installed. If you enable the Add using/Imports for NuGet package setting mentioned in the Writing Your Code section, you can add this package with one-click via “Ctrl+.”.
  • We added a ton of quick actions to help you embrace new language features, such as:
    • Use throw expression (C# 7.0) and null-coalescing operator (??) to simplify null-check.
    • Use explicitly provided tuple name (C# 7.0).
    • Use pattern-matching (C# 7.0) to simplify null-check.
    • Convert string.Format or concatenated string to an interpolated string (C# 6.0).
    • Use expression-bodied member for methods/constructors/indexers/properties/operators/accessors (C# 6.0/7.0).

Don’t forget to follow the language design for C# and Visual Basic on our new GitHub repos, CSharpLang and VBLang.

vbtupleexplicittype

Learning Hotkeys

Become a power user of Visual Studio by familiarizing yourself with common shortcut keys outlined in this cheat sheet. If you are coming to Visual Studio from another IDE, try Justin Clareburt’s Hot Keys 2017 extension to remap the default Visual Studio shortcuts to the ones you are used to.

Downloading Visual Studio 2017

With all the improvements to performance, navigation, debugging, refactorings, code style configuration/enforcement, and live unit testing there is no time to waste! Download Visual Studio 2017 today and take advantage of all the productivity features we have added to save you time and effort.

If you think we are missing a refactoring or quick action, please let us know by filing an issue on our GitHub.

imageKasey Uhlenhuth, Program Manager, .NET & Visual Studio
@kuhlenhuth
github.com/kuhlenh  Kasey is a program manager on the .NET Managed Languages team at Microsoft and is currently working on modernizing the C# and VB developer experience. Previously, she worked on C# Interactive and Node.js Tools for Visual Studio.

Iterations on infinity

$
0
0

iconarraymast1

Developers like you live with the Visual Studio icons every day: clicking on them multiple times, staring at them side by side on the taskbar, and seeing them attached to project files. So when we update them, it’s a big deal. After all, icons matter. For pictures that are at most just under a centimeter wide on a normal display (or under half an inch, for those of you who aren’t British like me), icons are huge. They pack a lot of meaning into a small space. They offer clues as to what kind of experience you’ll have with the application the icon represents. Some icons even establish an emotional connection: they make you feel something about something.

We’ve started rolling out a new series of icons to represent the Visual Studio product family. The classic purple infinity shape that you already know and recognize is sticking around. But you might say it’s gotten a promotion of sorts: the purple infinity by itself now represents the entire suite of products you’ve come to rely on. That includes our flagship Visual Studio IDE, Visual Studio Team Services, Blend for Visual Studio, and Visual Studio Mobile Center. The family also includes a macOS-style icon for Visual Studio for Mac, and a new icon for Visual Studio Code that will be revealed soon.

But the infinity symbol by itself isn’t enough. One of the problems our users have brought up for some time is not being able to tell different versions of Visual Studio products apart. For example, we had light blue icons for both Visual Studio Code and Visual Studio Team Services. That’s our fault, not yours. Even our own designers couldn’t always tell you which blue was which, and why. That got confusing for us, which meant it had to be confusing for you.

So we literally went back to the drawing board, if you’ll forgive the pun. We had a friendly competition among multiple design teams across three continents working on and iterating different concepts for the icon set. Icons for a major product family like Visual Studio should be visually attractive, but the requirements don’t stop there. They have to effectively communicate to a worldwide audience.

We faced several challenges designing this new icon set. Because the infinity shape has such strong existing-vsbrand recognition in the developer space, we wanted the new icons to look and feel as if they were an extension of that brand. To achieve this, the new icon set needed to be in the same style as the existing infinity shape. Deconstructing the infinity shape, it fits onto an underlying grid with two-point perspective. It’s got a thin vertical line on the left and a thick vertical line on the right, and the shape as a whole is made entirely of straight lines and strong angles that could be created by folding a ribbon. Finally, one of the most crucial directives our designers had was to follow was to use only a single flat color for each icon. Each new icon had to follow all these rules, using only one color, straight lines, ribbon folds for all corners, and trying to retain a thin vertical line on the left and a thick vertical line on the right. Different but similar. It wasn’t an easy task, even for some of the best artists and designers in the industry.

Within these start-menuconstraints and with the objective of building a whole icon set that conveys a sense of family, I’m quite proud of what our designers have accomplished. Most importantly, this new icon set has the familiar feeling of a Microsoft product family that’s part of the existing Microsoft brand. This familiar feeling is hard to pin down, but it’s essential. As I mentioned earlier, the purple infinity symbol is still around. In its classic dark purple, it now represents the whole Visual Studio family of products. In a lighter hue and with a stylized border, it represents our main IDE. You’ll absolutely know what to expect when you click on it. That’s a good thing.

The stylized border in the refreshed Visual Studio IDE icon is used in our other updated product icons as well. But instead of having to remember which icon is Visual Studio Code and which icon is Visual Studio Team Services based solely on color, each product icon now includes a unique pictogram that captures the individual flavor of each product. As each icon gets finalized and hard-coded into our different products, you’ll be able to tell that Blend and Code are both Visual Studio products, but are not the same thing. You’ll be able to tell the difference between Visual Studio Mobile Center and Visual Studio Team Services, and at the same time see that they’re part of the same product family.

vs-for-mac-logoIf you’re using Visual Studio for Mac, you’ll notice that the new product icon combines elements of both macOS and Windows visual design. We’ve used the purple infinity symbol, and set it against the common macOS pattern of a rotated rectangle. To make it pop on the macOS Dock, the Visual Studio for Mac icon has some added shading and detail.

Ultimately, the reason we put so much time and energy into refreshing these icons was to make your job easier. We always want you to be confident when you click on one of our icons, so you can get down to coding and focus on what you really want to focus on: making the best software in the world. Did we get it right? Tell us at UserVoice or use the Send Feedback tool in Visual Studio.

john-leaJohn Lea, Principal Design Director, Developer Division


Increasing PolyBase Row width limitation in Azure SQL Data Warehouse

$
0
0

Azure SQL Data Warehouse (SQL DW) is a SQL-based, fully managed, petabyte-scale cloud solution for data warehousing. SQL DW is highly elastic, you can provision in minutes and scale capacity in seconds. You can scale compute and storage independently, allowing you to burst compute for complex analytical workloads or scale down your warehouse for archival scenarios, and pay based off what you're using instead of being locked into predefined cluster configurations.

In the latest release of PolyBase in SQL DW, we have increased the row width limit to 1MB from 32KB. This will allow you to ingest your wide columns directly from Windows Azure Storage Blob or Azure Data Lake Store into SQL DW.

When thinking about loading data into SQL DW via PolyBase, you need to take into consideration a couple key points regarding the data size of strings.

  • For character types (char, varchar, nchar, nvarchar), the 1MB data size is based on memory consumption of data in UTF-16 format. This means that each character is represented by 2 bytes.
  • When importing variable length columns ((n)varchar, varbinary), the loading tool pads the buffer to the width of the schema in the external table definition regardless of data type. This means that a varchar(8000) has 8000 bytes reserved regardless of the size of the data in the row.

To help improve performance, define your external table with minimal amount of padding on schema data types to maximize the amount of data transferred per internal buffer.

Additionally, it is a best practice to use a medium or a large resource class and to scale up to a larger DWU instance to take advantage of additional memory needed for importing data, especially into CCI tables. More information can be found at our documentation for Memory allocation by DWU and Resource Class.

Next Steps

Give loading with External Tables into SQL DW a try with our loading tutorial.

Learn More

What is Azure SQL Data Warehouse?

What is Azure Data Lake Store?

SQL Data Warehouse best practices

MSDN forum

Stack Overflow forum

Announcing Azure SQL Database Premium RS, 4TB storage options, and enhanced portal experience

$
0
0

Today we are happy to announce the preview of the latest edition to our service tiers, Premium RS, a 4TB increase of storage limits for Premium P11 and P15, and along with it a new, enhanced portal experience for selecting and managing service tiers and performance levels.

Adding more choices in our service tiers and increasing the available storage is a crucial step towards reaching our long-term commitment of providing more flexibility. Both for compute as well as storage across all performance tiers, allowing increased flexibility to customers.

Premium RS

Premium RS is designed for your IO-intensive workloads that need Premium performance but do not require the highest availability guarantees. This tier is ideal for workloads can replay the data in case of a severe system error such as analytical workloads where the database is not system of record. In addition, Premium RS is great for non-production databases, such as development using in-memory technologies or pre-production performance testing. For more details refer to the documentation.

4TB storage option in Premium P11 and P15

You can now use up to 4TB of included storage with P11 and P15 Premium databases at no additional charge. Until we have worldwide availability later in CY 2017, the 4TB option can be selected for databases located in the following regions: East US 2, West US, Canada East and South East Asia (all starting March 9th) and West Europe, Japan East, Australia East, Canada Central (available today). For more details refer to the documentation.

Enhanced pricing tier portal experience

We have simplified your pricing tier manageability experience for databases in the portal. The configuration of your database can now be done in three simple steps reflecting the additional options we are providing such as Premium RS and additional storage configurations:

  1. Select the service tier which corresponds to your workload needs.
  2. Select the performance limits (DTU) required by your database.
  3. Select the maximum storage required to your database. This added option hopes to make it simpler for you to manage the growth of your databases.

NewPortalPricing

Next steps:

Introducing SQL Server Data Tools for Analysis and Reporting Services for Visual Studio 2017

$
0
0

Visual Studio 2017 brings improvements to performance, navigation, IntelliSense, Azure development, mobile development, and boosts productivity through live unit testing and real-time architectural dependency validation. There are many good reasons for developers to use Visual Studio 2017. And thanks to the timely availability of SSDT AS and RS for Visual Studio 2017, BI Pros do not have to wait or run multiple versions of Visual Studio side by side.

The release version of Visual Studio 2017 is available for download at https://visualstudio.com

The full SQL Server Data Tools (SSDT) for Visual Studio 2017 stand-alone download is not yet available. This is still a work in progress and should be available in the near future. The good news is that the installation packages for the preview versions of SQL Server Analysis Services and SQL Server Reporting Services project types are already available as Visual Studio Deployment (VSIX) packages. VSIX packages provide a straightforward way to deploy extensions and they open new deployment options. For example, you no longer need to search for a separate download if you already have Visual Studio. From any edition of Visual Studio 2017 – including Community – just check out the Visual Studio Marketplace for convenient access to the AS and RS project types. Select the Tools > Extensions and Updates menu option, and search for “SSDT”. The two new BI VSIX packages should be displayed, as the following screenshot illustrates.

ssdt-2017

The Visual Studio Marketplace can also keep the AS and RS project types updated automatically, which comes in very handy if you want to stay on the latest and hottest with every new release. A little notification in Visual Studio reminds you when we make new updates available. You can configure the update settings through the Extensions and Updates dialog box in Visual Studio.

Support for Integration Services for Visual Studio 2017 is in progress, but is not yet available. For now, we recommend using SSDT for Visual Studio 2015 if you need to use all the BI project types together in a solution.

Of course, we are also going to continue to provide a unified SSDT setup experience, which, as mentioned, will be available in a forthcoming release. But don’t delay! Download and install the SSDT AS and RS packages through the Visual Studio Marketplace and let us know how you like your new Visual Studio 2017 development environment!

Please provide feedback to the Microsoft Engineering team: ProBIToolsFeedback at microsoft.com.

Customized backlog levels, mobile work item form improvements, notifications for extensions – Mar 8

$
0
0

Note: The features discussed in this post will be rolling out over the next three weeks.

We have been focusing on improving your Team Services experience. This sprint includes several items, such as mobile work item form improvements and custom backlog levels. Let’s get into these features!

Delivery Plans field criteria

Delivery Plans have become more customizable with the addition of field criteria. This will give you greater control of which work items appear on your plans. Because field criteria is part of the plan, everyone will always see this same view of work. You can see in the example below that we are using field criteria to show only a certain work item type (bug) that contains a tag value (Argo).

delivery plans

New mobile discussion experience

Our mobile discussion experience has been optimized to provide a mobile-friendly, streamlined experience for submitting a comment. Discussion is the most common action that takes place in a mobile device. We look forward to hearing what you think about our new experience!

mobile discussion menu

mobile discussion

Optimized mobile identity picker

It is now extremely easy to assign a work item to a different user from your phone. The control has been optimized to provide a great mobile experience when filtering, searching, and selecting a user.

mobile identity

Customized backlog levels

Users can now add new backlog levels to manage the hierarchy of their work items and name them in a way that makes sense for their work item types. Users can also rename and recolor existing backlog levels, such as Stories or Features.

backlog levels

Custom work item identity fields

Users can now add custom identity fields to their projects. This allows users to define additional fields like “Assigned To”, which will give users a people-picker experience to select people as the field value. In this initial release, all users in the Team Services account will be valid values for each identity field.

Pull Request improvements for teams

If you’re a member of multiple teams, you will now see all of the PRs assigned to those teams listed in the My Pull Requests view. This makes the My Pull Requests view the one stop you need to visit to see all the PRs on your plate.

pr

In a future release, we’ll add teams to the Pull Requests hub under Code to make it easier to see all of your PRs for a single project.

New policy for no active comments

Ensure that all comments in your pull requests are being addressed with the new Comments policy. With this policy enabled, active comments will block completion of the PR, forcing all comments to be resolved. Reviewers that leave comments for the PR author but optimistically approve the pull request can be sure that an author that’s eager to merge won’t miss any comments.

pr policy

Build agent upgrade status

When an agent is being upgraded, it now indicates the status of the upgrade in the queue and pool management portal.

Github pull request builds

For a while, we’ve provided CI builds from your GitHub repo. Now we’re adding a new trigger so you can build your GitHub pull requests automatically. After the build is done, we report back with a comment in your GitHub pull request.

For security, we only build pull requests when both the source and target are within the same repo. We don’t build pull requests from a forked repo.

github builds

Out-of-the-box notifications enabled by default - coming soon

For your awareness, we are planning to enable out-of-the-box notifications by default in our next update in about three weeks. If this feature is already enabled in your account, there will be no impact. If you haven’t enabled this feature, it will be enabled by default in our next update. Account admins will still have the option to opt out of this feature.

Getting notified when extensions are installed, require attention, and more

Admins, or those with the ability to manage extensions for an account, are now automatically notified when an extension is installed, uninstalled, enabled, disabled, or requires attention in the account. This is especially useful in larger accounts where multiple people have the responsibility of managing extensions. Admins can turn off these notifications by navigating to Notification settings under the profile menu and switching off the extensions toggle.

Admins can also define custom subscriptions for extension-related events in the account. For example, an admin can get notified whenever any extension is updated in the account.

Users can also now turn off automatic notifications about their extension requests.

Release level approvals

You can now choose to automatically approve deployments that were automatically triggered after successful deployment to another environment. Approving a chain of deployments (which have the same approvers) can be done at one go if you choose to not approve every deployment.

Let’s say you have two environments Dev and Test, with the predeployment approvers set to “userA” and “userB,” with both of them required to approve the deployment. If the policy on Test is set as shown below, during deployment time it will be sufficient for userA and userB to approve only Dev. Deployment to Test will get auto-approved. If the deployment to Test is triggered manually, the approvals will be required before deployment to ensure correct approvals.

release approvers

.NET Core tasks support project files

With the current update, we are enhancing .NET core tasks to support *.csproj files in addition to project.json. You can now use Visual Studio 2017 on your build agents to build .NET core applications using csproj files.

We think these features will help improve your workflows while addressing feedback, but we would love to hear what you think. Please don’t hesitate to send a smile or frown through the web portal, or send other comments through the Team Services Developer Community. As always, if you have ideas on things you’d like to see us prioritize, head over to UserVoice to add your idea or vote for an existing one.

Thanks,

Aaron Bjork

Team Foundation Server 2017 Update 1 Available

$
0
0

Sorry, I had a farm day yesterday and am a little late on the announcement…

Yesterday we announced the release of both Visual Studio 2017 and TFS 2017 Update 1.  I’ll focus on TFS and you can read Julia’s post on VS.

IMPORTANT NOTE – A couple of days ago, we discovered a bug that was introduced very late that causes issues when upgrading a pre-TFS 2015 server.  There are no issues upgrading any TFS 2015 (or any Update to 2015).  Do not try to upgrade an earlier server yet.  We will update the installer bits on Friday with a fix and, as long as you download it after that, it should work on any supported TFS version.  I will update this post once the fix has been uploaded.  You don’t need to worry about TFS 2015 upgrades.  The issue is in the upgrade logic and has no effect whatsoever on TFS 2015 upgrades.  I apologize for making customers on earlier versions wait a little longer.

Other TFS related 2017 downloads:

Please checkout the release notes to see all the great stuff that’s in Update 1.  We’re thrilled to have been able to make it available to you.  We’re already hard at work on Update 2 (which I expect sometime this summer).  To get a sneak peek at what’s coming, check out our Feature Timeline.

As always, we are eager to hear your feedback,

Brian


Announcing Windows 10 Insider Preview Build 15051 for Mobile

$
0
0

Hello Windows Insiders!

Today we are excited to be releasing Windows 10 Insider Preview Build 15051 for Mobile to Windows Insiders in the Fast ring.

Other changes, improvements, and fixes for Mobile

  • We appreciate several of you sending us feedback on this and last week, we focused on fixing issues that resulted in frequent reboots for some Insiders on Build 15047. If you continue to experience unexpected reboots, be sure to send in feedback to us via Feedback Hub so the team can take a look!
  • We fixed an issue resulting in certain inbox apps, such as Calculator, Outlook Mail, Outlook Calendar, Groove Music, no longer being present on the system after a hard reset.
  • We fixed an issue resulting in Groove Music not resuming playback after ending a phone call if the app became suspended during the call.
  • We fixed an issue where periodically attaching larger photos to a message in Messaging wouldn’t work.
  • We fixed an issue from recent flights where, in certain apps, if you had selected editable text and pressed Shift on the keyboard, the keyboard would crash.
  • We fixed an issue impacting certain UWP apps using pivots, such as the News app, where the pivot control could end up becoming offset after quickly swiping through the pivots.
  • We fixed an issue where asking Cortana to read a text message over Bluetooth with many back to back emoji would result in high pitched distorted noise.
  • We fixed an issue where after upgrading some Insiders were unexpectedly seeing the full QWERTY keyboard on the lock screen instead of the pin pad.

Known issues for Mobile

  • We have discovered a bug that causes background tasks to not run in the background like they should such as OneDrive’s camera roll sync feature. Please double check your photos have synced to OneDrive on the latest builds. We’ve got a fix for this issue coming in an upcoming build where background tasks will run again and your camera roll will sync to OneDrive as expected.
  • If your device experiences an unexpected reboot, in some cases you may lose your call, text, and email history may be lost. We’re actively investigating this issue. If you believe you’ve hit this, please up-vote this feedback item In Feedback Hub.
  • Speech packs may be unable to download on this build.

Community Updates

We are huge fans of wielding one’s technical superpowers for good and were incredibly happy to meet with Windows Insider Paula Aliu, the CEO of Cogno-Aid in Nigeria. Cogno-Aid is a business that aims to connect people to licensed therapists from the comfort of their safe place, step one of removing the stigma of mental health care.

Paula Aliu, the CEO of Cogno-Aid in Nigeria

Paula was a Computer Science student who was inspired to start this business after losing her college friend to suicide from a mental health disorder that no one was aware existed. Mental health is not something most Nigerians talk about openly. She decided to use her technical superpower to make Nigeria a more healthy place for all with her online business that she’s built using Windows.

We’re so incredibly proud of our global community of Windows Insiders and can’t wait to follow along on Paula’s journey as she launches her business to an even broader audience.

We love hearing your stories so if you have one to share, please get in touch with me on Twitter.

Keep hustling team and happy International Women’s Day,
Dona <3

The post Announcing Windows 10 Insider Preview Build 15051 for Mobile appeared first on Windows Experience Blog.


Team Services Update – Mar 8, 2017

$
0
0

This week we are deploying our sprint 114 work.  Check out the release notes to read the details.  As usual, it will take a couple of weeks for the changes to roll out across all accounts.

Here’s a CliffsNotes version of some of the highlights of this sprint:

  • Delivery plans continue to make progress with new abilities to filter the cards on your board.
  • The mobile work item experience gets a new mobile optimized discussion control.
  • Pull Requests now understand teams and will show you all pull requests assigned to any team you are a member of.
  • Teams that do development on GitHub can now use the Team Services CI/CD experience for GitHub pull request builds (CI builds already worked).

I hope you enjoy the new improvements and I look forward to hearing your feedback…

Brian

DSC Resource Kit Release March 2017

$
0
0

We just released the DSC Resource Kit!

This release includes updates to 10 DSC resource modules, including 19 new DSC resources. In these past 6 weeks, 155 pull requests (the most ever!) have been merged and 71 issues have been closed, all thanks to our amazing community!

A few weeks ago we also released a new DSC resource module called SecurityPolicyDsc with resources to configure local security policies through secedit. Thank you to Jason Walker for this great new module!

The modules updated in this release are:

  • OfficeOnlineServerDsc
  • PSDscResources
  • SecurityPolicyDsc
  • SharePointDsc
  • xCertificate
  • xExchange
  • xPSDesiredStateConfiguration
  • xRemoteDesktopSessionHost
  • xSQLServer
  • xWindowsUpdate

For a detailed list of the resource modules and fixes in this release, see the Included in this Release section below.

Our last community call for the DSC Resource Kit was last week on March 1. A recording of our updates as well as summarizing notes are available. Join us next time at 9AM PST on April 12 to ask questions and give feedback about your experience with the DSC Resource Kit. Keep an eye on the community agenda for the link to the call.

We strongly encourage you to update to the newest version of all modules using the PowerShell Gallery, and don’t forget to give us your feedback in the comments below, on GitHub, or on Twitter (@PowerShell_Team)!

All resources with the ‘x’ prefix in their names are still experimental – this means that those resources are provided AS IS and are not supported through any Microsoft support program or service. If you find a problem with a resource, please file an issue on GitHub.

Included in this Release

You can see a detailed summary of all changes included in this release in the table below. For past release notes, go to the README.md or Changelog.md file on the GitHub repository page for a specific module (see the How to Find DSC Resource Modules on GitHub section below for details on finding the GitHub page for a specific module).

Module NameVersionRelease Notes
OfficeOnlineServerDsc1.0.0.0
  • Added documentation to the module to finalise for release
  • Renamed resources to shorten names before release
    • “OfficeOnlineServerWebAppsFarm” becomes “OfficeOnlineServerFarm”
    • “OfficeOnlineServerWebAppsMachine” becomes “OfficeOnlineServerMachine”
PSDscResources2.5.0.0
  • Enable codecov.io code coverage reporting
  • Group
    • Added support for domain based group members on Nano server.
  • Added the Archive resource
  • Update Test-IsNanoServer cmdlet to properly test for a Nano server rather than the core version of PowerShell
  • Registry
    • Fixed bug where an error was thrown when running Get-DscConfiguration if the registry already existed
SecurityPolicyDsc1.2.0.0
  • SecurityTemplate: Remove [ValidateNotNullOrEmpty()] attribute for IsSingleInstance parameter
  • Fixed typos
SharePointDsc1.6.0.0
    • Updated SPWebApplication to allow Claims Authentication configuration
    • Updated documentation in regards to guidance on installing binaries from

network locations instead of locally

  • New resources: SPFarmPropertyBag
  • Bugfix in SPSite, which wasnt returing the quota template name in a correct way
  • Bugfix in SPAppManagementServiceApp which wasnt returning the correct database

name

  • Bugfix in SPAccessServiceApp which did not return the database server
  • Bugfix in SPDesignerSettings which filtered site collections with an incorrect

parameter

  • Updated the parameters in SPFarmSolution to use the full namespace
  • Bugfix in SPFarmsolution where it returned non declared parameters
  • Corrected typo in parameter name in Get method of SPFeature
  • Added check in SPHealAnalyzerRuleState for incorrect default rule schedule of

one rule

  • Improved check for CloudSSA in SPSearchServiceApp
  • Bugfix in SPSearchServiceApp in which the database and dbserver were not

returned correctly

  • Improved runtime of SPSearchTopology by streamlining wait processes
  • Fixed bug with SPSearchServiceApp that would throw an error about SDDL string
  • Improved output of test results for AppVeyor and VS Code based test runs
  • Fixed issue with SPWebAppPolicy if OS language is not En-Us
  • Added SPFarm resource, set SPCreateFarm and SPJoinFarm as deprecated to be

removed in version 2.0

xCertificate2.4.0.0
  • Converted AppVeyor build process to use AppVeyor.psm1.
  • Correct Param block to meet guidelines.
  • Moved shared modules into modules folder.
  • xCertificateExport:
    • Added new resource.
  • Cleanup xCertificate.psd1 to remove unneccessary properties.
  • Converted AppVeyor.yml to use DSCResource.tests shared code.
  • Opted-In to markdown rule validation.
  • Examples modified to meet standards for auto documentation generation.
xExchange1.14.0.0
  • xExchDatabaseAvailabilityGroup: Added parameter AutoDagAutoRedistributeEnabled,PreferenceMoveFrequency
xPSDesiredStateConfiguration6.1.0.0
  • Moved DSC pull server setup tests to DSCPullServerSetup folder for new common tests
  • xArchive:
    • Updated the resource to be a high quality resource
    • Transferred the existing “unit” tests to integration tests
    • Added unit and end-to-end tests
    • Updated documentation and examples
  • xUser
    • Fixed error handling in xUser
  • xRegistry
    • Fixed bug where an error was thrown when running Get-DscConfiguration if the registry key already existed
  • Updated Test-IsNanoServer cmdlet to properly test for a Nano server rather than the core version of PowerShell
xRemoteDesktopSessionHost1.4.0.0
  • Updated CollectionName parameter to validate length between 1 and 15 characters, and added tests to verify.
xSqlServer6.0.0.0
  • Changes to xSQLServerConfiguration
    • BREAKING CHANGE: The parameter SQLInstanceName is now mandatory.
    • Resource can now be used to define the configuration of two or more different DB instances on the same server.
  • Changes to xSQLServerRole
    • xSQLServerRole now correctly reports that the desired state is present when the login is already a member of the server roles.
  • Added new resources
    • xSQLServerAlwaysOnAvailabilityGroup
  • Changes to xSQLServerSetup
    • Properly checks for use of SQLSysAdminAccounts parameter in $PSBoundParameters. The test now also properly evaluates the setup argument for SQLSysAdminAccounts.
    • xSQLServerSetup should now function correctly for the InstallFailoverCluster action, and also supports cluster shared volumes. Note that the AddNode action is not currently working.
    • It now detects that feature Client Connectivity Tools (CONN) and Client Connectivity Backwards Compatibility Tools (BC) is installed.
    • Now it can correctly determine the right cluster when only parameter InstallSQLDataDir is assigned a path (issue 401).
    • Now the only mandatory path parameter is InstallSQLDataDir when installing Database Engine (issue 400).
    • It now can handle mandatory parameters, and are not using wildcards to find the variables containing paths (issue 394).
    • Changed so that instead of connection to localhost it is using $env:COMPUTERNAME as the host name to which it connects. And for cluster installation it uses the parameter FailoverClusterNetworkName as the host name to which it connects (issue 407).
    • When called with Action = “PrepareFailoverCluster”, the SQLSysAdminAccounts and FailoverClusterGroup parameters are no longer passed to the setup process (issues 410 and 411).
    • Solved the problem that InstanceDir and InstallSQLDataDir could not be set to just a qualifier, i.e “E:” (issue 418). All paths (except SourcePath) can now be set to just the qualifier.
  • Enables CodeCov.io code coverage reporting.
  • Added badge for CodeCov.io to README.md.
  • Examples
    • xSQLServerMaxDop
      • 1-SetMaxDopToOne.ps1
      • 2-SetMaxDopToAuto.ps1
      • 3-SetMaxDopToDefault.ps1
    • xSQLServerMemory
      • 1-SetMaxMemoryTo12GB.ps1
      • 2-SetMaxMemoryToAuto.ps1
      • 3-SetMinMaxMemoryToAuto.ps1
      • 4-SetMaxMemoryToDefault.ps1
    • xSQLServerDatabase
      • 1-CreateDatabase.ps1
      • 2-DeleteDatabase.ps1
  • Added tests for resources
    • xSQLServerMaxDop
    • xSQLServerMemory
  • Changes to xSQLServerMemory
    • BREAKING CHANGE: The mandatory parameter now include SQLInstanceName. The DynamicAlloc parameter is no longer mandatory
  • Changes to xSQLServerDatabase
    • When the system is not in desired state the Test-TargetResource will now output verbose messages saying so.
  • Changes to xSQLServerDatabaseOwner
    • Fixed code style, added updated parameter descriptions to schema.mof and README.md.
xWindowsUpdate2.6.0.0
    • Converted appveyor.yml to install Pester from PSGallery instead of from

Chocolatey.

  • Fixed PSScriptAnalyzer issues.
  • Fixed common test breaks (markdown style, and example style).
  • Added CodeCov.io reporting
  • Deprecated xMicrosoftUpdate as it”s functionality is replaced by xWindowsUpdateAgent

How to Find Released DSC Resource Modules

To see a list of all released DSC Resource Kit modules, go to the PowerShell Gallery and display all modules tagged as DSCResourceKit. You can also enter a module’s name in the search box in the upper right corner of the PowerShell Gallery to find a specific module.

Of course, you can also always use PowerShellGet (available in WMF 5.0) to find modules with DSC Resources:

# To list all modules that are part of the DSC Resource KitFind-Module-Tag DSCResourceKit # To list all DSC resources from all sources Find-DscResource

To find a specific module, go directly to its URL on the PowerShell Gallery:
http://www.powershellgallery.com/packages/< module name >
For example:
http://www.powershellgallery.com/packages/xWebAdministration

How to Install DSC Resource Modules From the PowerShell Gallery

We recommend that you use PowerShellGet to install DSC resource modules:

Install-Module-Name < module name >

For example:

Install-Module-Name xWebAdministration

To update all previously installed modules at once, open an elevated PowerShell prompt and use this command:

Update-Module

After installing modules, you can discover all DSC resources available to your local system with this command:

Get-DscResource

How to Find DSC Resource Modules on GitHub

All resource modules in the DSC Resource Kit are available open-source on GitHub.
You can see the most recent state of a resource module by visiting its GitHub page at:
https://github.com/PowerShell/< module name >
For example, for the xCertificate module, go to:
https://github.com/PowerShell/xCertificate.

All DSC modules are also listed as submodules of the DscResources repository in the xDscResources folder.

How to Contribute

You are more than welcome to contribute to the development of the DSC Resource Kit! There are several different ways you can help. You can create new DSC resources or modules, add test automation, improve documentation, fix existing issues, or open new ones.
See our contributing guide for more info on how to become a DSC Resource Kit contributor.

If you would like to help, please take a look at the list of open issues for the DscResources repository.
You can also check issues for specific resource modules by going to:
https://github.com/PowerShell/< module name >/issues
For example:
https://github.com/PowerShell/xPSDesiredStateConfiguration/issues

Your help in developing the DSC Resource Kit is invaluable to us!

Questions, comments?

If you’re looking into using PowerShell DSC, have questions or issues with a current resource, or would like a new resource, let us know in the comments below, on Twitter (@PowerShell_Team), or by creating an issue on GitHub.

Katie Keim
Software Engineer
PowerShell Team
@katiedsc (Twitter)
@kwirkykat (GitHub)

Uncovering cross-process injection with Windows Defender ATP

$
0
0

Windows Defender Advanced Threat Protection (Windows Defender ATP) is a post-breach solution that alerts security operations (SecOps) personnel about hostile activity. As the nature of attacks evolve, Windows Defender ATP must advance so that it continues to help SecOps personnel uncover and address the attacks.

With increasing security investments from Microsoftread how Windows 10 continues to raise the bar against a spectrum of attacksand other vendors, the cost and complexity of delivering successful exploits has swelled. For example, the trend towards virtualization-based security is forcing attacks to incorporate at least two exploits: one to compromise the sandboxed application and another to break out of the sandbox. We are now seeing exploit developers charge as high as hundreds of thousands of dollars for remote code execution and kernel exploits, pricing out some attackers from the market.

Unfortunately, advanced and apex attackers (see Figure 1) can still afford to develop or purchase zero-day exploits. To protect their investments, these attackers put more emphasis in evading detection. They rely heavily on in-memory attacks and kernel privilege escalation to avoid touching the disk and remain extremely stealthy.

Attacker proficiency and associated techniques

Figure 1. Attacker proficiency and associated techniques

This blog post kicks off a three-part series showcasing the investments made by Microsoft to enhance instrumentation and detection of in-memory techniques. The series covers detection improvements for cross-process code injection, kernel escalation and tampering, and in-memory exploitation. In this first post, we focus on cross-process injection and illustrate how enhancements that will be available in the Creators Update for Windows Defender ATP detect a broad set of attack activity: from commodity malware that attempt to hide from plain view to sophisticated activity groups that engage in targeted attacks.

Cross-process injection for stealth and persistence

Cross-process injection can be used to provide an attacker more visibility into normal processes. For example, injected code can record keystrokes sent to an affected process. At the same time, this method hides malicious code and enables process migration, which can be used for organizational persistence.

Cross-process injection is inherently stealthy because it conceals malicious code inside benign processes. Even when a process has been injected with malicious code, its loaded images (the executable and library files associated with the process) continue to point to legitimate files on disk as shown in Figure 2. This shows a clear advantage over running malicious code in its own process space, which necessitates that the code reside on disk as an image file that is subject to inspection by antimalware and is easily recovered as forensic evidence.

Loaded images of rundll32.exe appear normal even when injected with malware code

Figure 2. Loaded images of rundll32.exe appear normal even when injected with malware code

By enabling process migration, cross-process injection allows attacks to stay active. In a drive-by-download attack, for instance, an attacker can gain control of the browser process and disable its sandbox. To execute malicious code beyond the lifecycle of the browser, which may terminate at any time, the attacker migrates the malicious code to a long-lived process, such as winlogon.exe, using cross-process injection. The risk of a user powering down the machine and erasing the malware remains, but an apex attacker overcomes this by staying active on multiple devices on the enterprise network. If one device is indeed restarted and the malicious code erased, the attacker can easily move laterally back to that device.

Digging deeper into cross-process injection

Cross-process injection is basically a two-fold process.

First, malicious code is placed into a new or existing executable page within a remote process. Attackers typically use the Win32 APIs VirtualAllocEx and CreateFileMapping/MapViewOfSection to allocate new executable pages. They then use VirtualProtectEx to turn existing pages into executable and writeable pages.

Next, the injected malicious code is executed through control of the thread and execution context. In many notable cases, attackers use the API CreateRemoteThread to create a new thread in a remote process. They then use APIs SetThreadContext and QueueUserAPC to redirect the existing thread to an arbitrary address.

While there are legitimate uses for the aforementioned APIs—they are used for debugging, diagnostics, management, and security—particular combinations of process names and execution behaviors often indicate malicious activity. For the technically inclined, techniques such as process hollowing (described by Tan Chew Keong in his paper “Dynamic Forking of Win32 EXE”)  and more obscure theoretical attacks such as AtomBombing are good examples of these malicious combinations.

Instrumentation and detection in Windows Defender ATP

In Creators Update for Windows Defender ATP, we have instrumented related function calls and built statistical models to detect a broad range of malicious injection techniques used in the wild. To determine how these enhancements effectively uncover hostile activities that leverage cross-process injection, we tested the enhancements against the following real-world cases: a targeted attack, a remote access tool (RAT), and cryptocurrency mining malware.

Targeted attack by GOLD

GOLD is an activity group that primarily seeks out intellectual property and other valuable digital assets. This activity group has an interesting way of obtaining a foothold in enterprise networks. Instead of actively pursuing targets through spear-phishing, GOLD uses established distribution sites for license-key generators (keygens) to infect a wide array of victims—all users who download and execute keygens from the distribution sites. The group then assesses each of the victims and aggressively pursues those in certain industries.

As a user launches a keygen package downloaded from the website operated by GOLD, the package drops two executables: the actual keygen and the Gatak malware implant. Gatak proceeds to inject itself into one of the many legitimate system processes using the CreateRemoteThread API. The sample we tested launches the rundll32.exe process, allocates memory in the process, writes malicious code to that location, and executes the malicious code using CreateRemoteThread calls. Upon successful injection, Gatak removes itself from disk. Meanwhile, code injected in the rundll32.exe process communicates with command-and-control (C&C) servers, giving GOLD attackers control over the infected device.

With Creators Update, Windows Defender ATP will uncover breaches involving Gatak by detecting its cross-process injection technique, among other detection mechanisms it can use. Figure 3 shows the alert on the Windows Defender ATP Creators Update portal.

Detection of Gatak malware implant injecting into rundll32.exe

Figure 3. Detection of Gatak malware implant injecting into rundll32.exe

Fynloski RAT

The second piece of malicious activity we used to test our new detections for cross-process injection is a variant of the Fynloski remote access tool (RAT). This RAT was freely available until 2012 and is still in use today in multiple attack campaigns. It provides a broad set of functionality, including capturing screenshots, exfiltrating files, and recording keystrokes. It is distributed by different vectors, including spear-phishing, downloaders, and exploit kits.

Instead of using the more common CreateRemoteThread cross-process injection technique described in preceding sections, Fynloski leverages the QueueUserAPC API to hide its presence. QueueUserAPC is a function for requesting the execution of procedures asynchronously. Attackers can use QueueUserAPC to inject arbitrary code cross-process by provisioning malicious code in the target process and pointing QueueUserAPC to execute this code.

With Creators Updates, Windows Defender ATP will detect these API calls and display an alert with a corresponding timeline that outlines this behavior as shown in Figure 4.

Fynloski RAT injecting into notepad.exe

Figure 4. Fynloski RAT injecting into notepad.exe

Commodity malware for cryptocurrency mining

Commodity malware uses cross-process injection techniques for the same reason attackers use them in targeted attacks—they want to remain hidden long enough to accomplish their objectives.

In this article, we dissect the CoinMiner malware, which steals computing resources to mine cryptographic currencies such as Bitcoins. It uses SetThreadContext API for cross-process injection, copying malicious code into allocated executable memory similar to the CreateRemoteThread technique. To execute the malicious code, it first obtains a list of existing threads from the target process using CreateToolhelp32Snapshot API. It then modifies the control registers of a thread to point to the memory address of the injected malicious code using the SetThreadContext API.

Our sample of CoinMiner launches notepad.exe and injects its mining code into that process. Subsequently, the affected notepad.exe process connects to the Monero Mining Pool (xmr[.]crypto-pool[.]fr) to submit mined cryptocurrency. Windows Defender ATP, as shown in Figure 5, will detect the injection technique and provide important context, such as the connection to the mining pool, to help SecOps personnel understand and address the infection.

Event timeline view of CoinMiner infection

Figure 5. Event timeline view of CoinMiner infection

Conclusion: Creators Update is ready for a mix of cross-process injection methods

Like other in-memory techniques, cross-process injection can evade antimalware and other security solutions that focus on inspecting files on disk. With Creators Update, Windows Defender ATP will provide SecOps personnel with additional capabilities to uncover malicious activities leveraging cross-process injection. By leveraging statistical models and analyzing large data sets in the cloud, these enhancements cover code injection techniques used in a variety of attacks, including commodity malware infections and sophisticated breaches.

Windows Defender ATP also provides detailed event timelines as well as other contextual information that SecOps personnel can use to quickly understand the nature of attacks and take response actions.

For more information about Windows Defender ATP, check out its features and capabilities and read about why a post-breach detection approach is a key component of any enterprise security stack. Several features planned for release with Creators Update are currently available to all users as part of the public preview.

Windows Defender ATP is built into the core of Windows 10 Enterprise and can be evaluated free of charge.


Threat indicators

Hashes

  • Gatak – 137d6fdc9ca730304a2154174058144f4e909824
  • Fynloski – efb9a13ad450bb0381ee1cc3b90ac0266687928a
  • CoinMiner – d36fa8de43956190d827c042614555c8b20c5402

Infrastructure

  • 207[.]36[.]232[.]49
  • 212[.]129[.]44[.]157
  • Xmr[.]crypto-pool[.]fr

Christian Seifert, Genghis Karimov, Mathieu Letourneau

Windows Defender ATP Research Team


Relationship Hacks - Mindfulness - Don't live your life by default

$
0
0

Setting the DefaultsI'm setting a goal for myself to finish my half-finished book relationshiphacks.com this year. In an attempt to make that happen (and because the recent podcast with my wife was wildly popular) I'm going to try to blog some guiding principles. Then I'll attempt to collect the feedback and comments, improve the posts, then move them into the book. Yesterday I posted about "An allowance system for adults."

In this post on I want to touch briefly on the concept of "mindfulness." When I was younger I didn't know this term so I said "don't live your life by default." Phrased alternatively, "don't let your life happen by default."

I mentioned it years ago on a podcast and Paul Apostolos did a very nice blog post where he paraphrased:

Teach your children to make life choices rather than just let life happen to them.

Now, to be clear, stuff happens and this isn't always possible. There's luck, there's planning, there's inherent privilege, but the root idea of mindfulness and awareness is crucial. As they say, "Luck Is what happens when preparation meets opportunity"

I met with a young mentee today who is considering not just leaving her job but also moving to a totally different career. What I appreciated about her perspective and questions was that she clearly was going into the future fully aware of the possibilities. She embraced both the potential good and bad possibilities with a conscious and mindful awareness that was inspiring.

She wasn't going to just "let whatever happen, happen." She wasn't going to just start the game and accept the defaults. She is opening open the options menu of life and trying to change the settings consciously.

I'm doing my best to teach my kids this, hopefully by example. Yes there are things they can't change about themselves, but the one thing they can change (or try) is how they think and how they act. I catch them saying things like "I'm not good at math." They have tapes that are already starting to run in their little heads that feed them negativity and inaction. The defaults are just doing nothing. Humans (myself included) can be very lazy. I want them to build up their reservoirs of self-esteem and "I can do it" so they don't accept the defaults.

Do you have any stories of where you "woke up" and realized you were coasting (perhaps for a week, perhaps for years) and were just accepting the defaults in your life? How did you break out of that thinking?


Sponsor: Get next level application monitoring with Raygun - The revolutionary software intelligence platform for your web and mobile apps. Take a free trial today!


© 2017 Scott Hanselman. All rights reserved.
     

What is Happening Inside Enterprise Mobility?

$
0
0

I recently met with Nick McQuire from CCS Insights to see some of his new research on Enterprise Mobility. I really encourage you to read the blog post.

In the post, Nick describes the trends and changes he discovered in the data gathered from a survey of more than 400 mobile technology decision makers in the United Stated and Europe. Two of the points in his report below stood out to me:

Acceleration of Windows 10 Deployment & the Convergence of PC and Mobile Device Management

The CCS research identifies the same trends we have been seeing in both the acceleration of Windows 10 adoption, as well as the convergence of the PC Management and Enterprise Mobility Management teams and strategies. According to the survey:

  • 86% of firms stated they would upgrade their Windows PCs to Windows 10 within 3-4 years.
  • 47% of those orgs say they will upgrade in the next 12 months.
  • 83% of the firms said they planned to converge their PC management and Enterprise Mobility management strategy and teams.
  • 44% of firms say they planned to do this convergence within the next 12 months.

These figures match the same feedback were getting in just about every one of our customer conversations. To give you a sense of what we see internally, here are some data points weve found in the telemetry that comes back to Microsoft from millions of devices around the world:

  • We see a significant acceleration in the rate of Windows 10 deployments worldwide.
  • I am tracking dramatic growth on a weekly and monthly basis that shows almost all of these new Windows 10 devices are deployed and managed through ConfigMgr and Intune.
  • Its not surprising to see that 99%+ of the Windows 10 devices reporting telemetry to Microsoft are being managed by ConfigMgr or Intune with the majority of the Windows 10 devices being managed by ConfigMgr.
  • Of the 85M monthly active users of Office 365, over 95% of the cloud identities are being managed by Azure Active Directory (Premium). If you are using something else as your IDP, you are built on a configuration that is not widely used. You can massively simplify if you move to just use what comes from Microsoft.
  • Our most recent quarterly earnings revealed that EMS grew more than 135% over the previous quarter- a staggering 400% faster than the nearest EMM provider.
  • We now have the largest EMM customer base with more than 41k unique customers which is 200% – 300% larger than other EMM providers.
  • The Enterprise Mobility + Security (EMS) suite from Microsoft is the largest Enterprise Mobility Management (EMM) and Identity as a Service (IDaaS) solution in the market.

Leading enterprise organizations are successfully converging their PC management and EMM strategies with ConfigMgr and EMS, and we have built an integrated solution that enables your Active Directory and ConfigMgr investments, as well as your organizations expertise, to be easily extended to managing mobile devices, cloud identities, and the SaaS apps your employees are using.

If you’re defining and implementing your go-forward strategy for bringing together your PC management, Enterprise Mobility management, and Identity protection/management strategies, I am convinced the solution will most likely be based on AD/ConfigMgr + EMS.

SaaS apps are the most used apps on mobile devices

Another part of the CCS research that I found really interesting was this data about the most commonly used apps on employees’ mobile devices:

1

See any patterns?

Here is another view of this same list categorized by regular, occasional, and rare usage.

2

As I was looking over these two tables, two big things jumped out to me:

  • The most commonly used apps are predominately SaaS apps. It really is a mobile-first, cloud-first world!!
  • EMS has the most comprehensive solution for managing the most-used apps.

EMS has integrated with all of the SaaS apps noted above to provide a great single-sign-on experience for users, as well as give IT the ability to bring these SaaS apps under management (heres how to get it up and running). With each of these SaaS apps, EMS offers the ability to provide real-time conditional access (block/allow) based on risks associated with the user identity, the device being used, the app being used, and the physical location of the user/device. One of the most important things that we provide for each of these SaaS apps is the ability to identify user accounts exhibiting suspicious behaviors (indicating a compromised user account) while attempting to access corporate content. The conditional access capabilities within EMS protects this access to company data in the SaaS services.

You also need the ability to protect the data when it is accessed and stored on mobile devices. The concept here is pretty well understood, e.g. you need to separate company data from personal data and apply data loss prevention policies to the company data (while staying away from that personal data). This is usually referred to as Mobile Application Management, containers, application configuration, etc. Looking at the lists above, EMS has the broadest support and depth of management for the apps associated with these services.

EMS provides the broadest and most comprehensive solution for managing, protecting, and securing company data in these SaaS apps while at the same time providing a wonderful and empowering experience for your users.

Perhaps my favorite statement from the CCS research is the following:

A hot question I hear often from IT leaders is “Who’s winning in this market?” Over the past 12 months, judging by our survey, the answer is Microsoft. Propelled by a big year in security, cloud, productivity apps and the positivity surrounding Windows 10, Microsoft has grown its brand credibility significantly, especially against Apple.

We are humbled by the incredible excitement and interest we’re seeing in the work weve done with Windows 10, ConfigMgr, and EMS. As we continue building and delivering these services, one of the things that I’m most pleased about is the feedback from those who are benefitting from how different Microsoft is today compared to just a couple years ago. It is very rewarding to hear that our efforts to listen to customers and to adjust what were delivering based on those needs is making a difference. This emphasis on agility and customer-centricity is really exciting to see in action.

160+ Code Samples for Bing Maps V8 released on GitHub

$
0
0

The Bing Maps team has been working hard on adding features and functionalities to the Bing Maps Version 8 web control (V8). With each feature the team creates they also create several code samples to thoroughly test it. Many of the basic implementation samples are made available as code samples in the Bing Maps V8 interactive SDK while more in-depth code samples have generally been made available through blog posts, MSDN documentation and as answers to developers on the Bing Maps forums. Today we are happy to announce the release of the Bing Maps V8 Code Samples project on GitHub, which pulls all these code samples into a single place. Check out the GitHub Project or view the Live Code Samples site. Here are a few of the samples included in this project.

Spider Clusters

The following is the Spider Clusters sample, which demonstrates how to take clustered pushpins and display the pushpins they contain in a connected spiral when they are clicked.

Try it now | Source Code

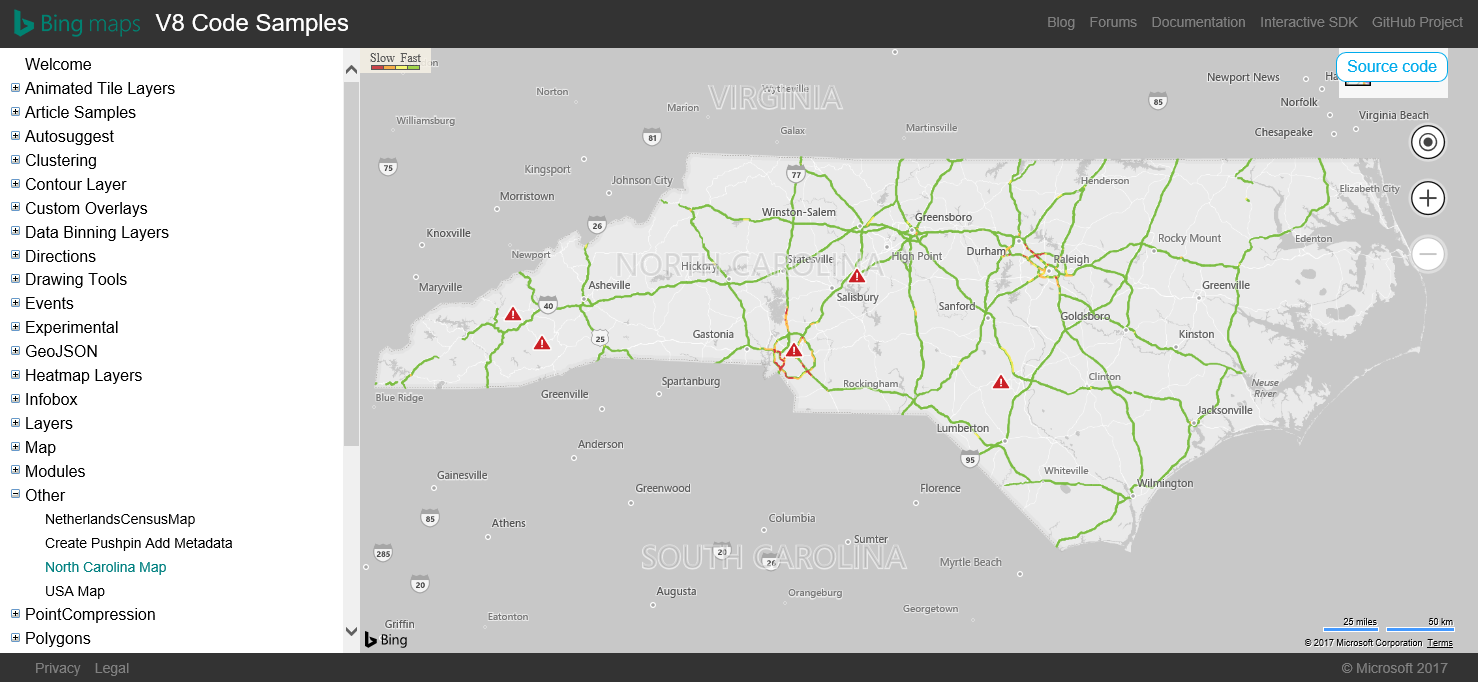
North Carolina Map

This sample shows how to create a map that focuses on a specific area. Besides locking the map view to that area, a polygon mask is also added to the map to hide rods and traffic data that is outside of the area of interest, in this case North Carolina.

Try it now | Source Code

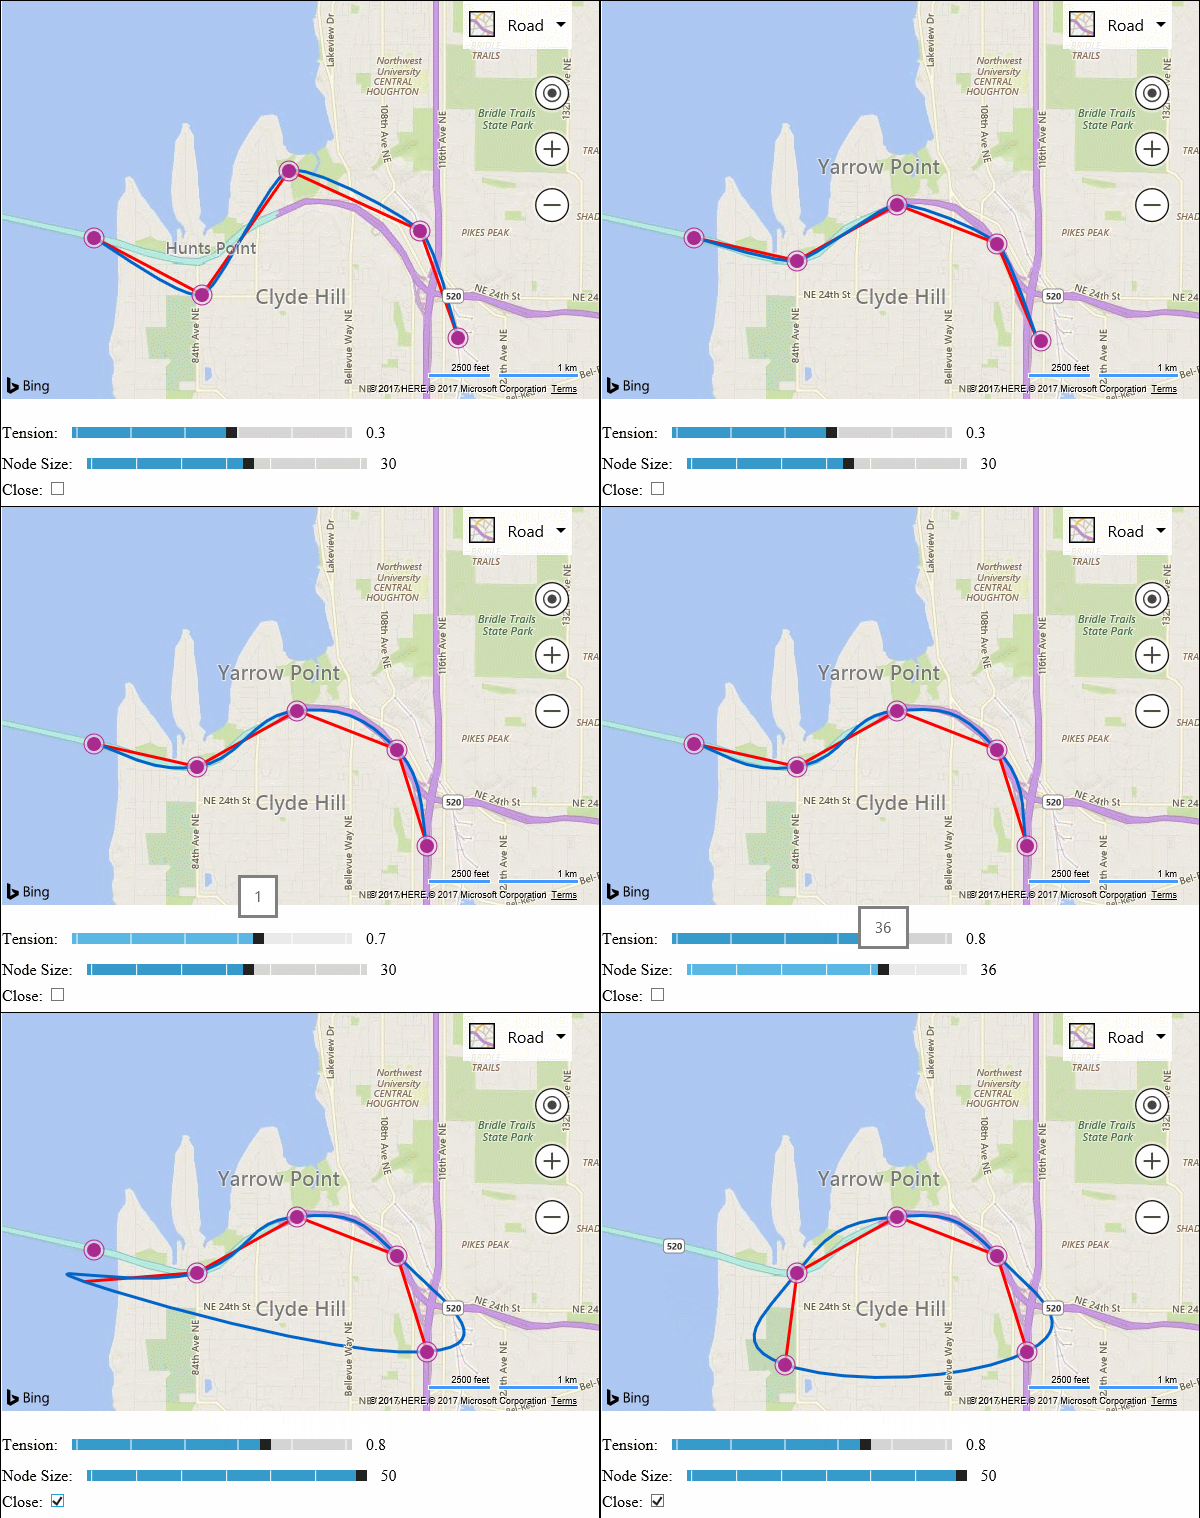
Cardinal Spline Features

The following code sample demonstrates all the features of the Cardinal Spline function that is available in the Spatial Math module of Bing Maps V8. The red line is a standard polyline connecting the pushpins while the blue line is the cardinal spline. Drag the pushpins, change the tension and node size to see how the cardinal spline changes.

Try it now | Source Code

Join the fun

Have a great code sample or idea for one? Submit it to the Bing Maps V8 Code Samples project on GitHub and make it available to others.

Related Posts

Announcing support for Amazon Redshift connectivity in the Power BI service

$
0
0
A few months ago we released a Preview of the Amazon Redshift connector in Power BI Desktop. This new connector allows users to easily build reports based on their Redshift data, either by importing the data into Power BI Desktop or by using DirectQuery mode. Today we are very excited to announce support for Redshift-based reports in the Power BI Service, allowing users to publish their reports to unlock seamless consumption of reports & dashboards based on Redshift data. In this blog post, we will show you step-by-step how to accomplish this task.

Conditional Access “limited access” policies for SharePoint are in public preview!

$
0
0

Howdy folks,

Enabling productivity while securing data is the fine line IT pros walk today, and having the right tools to do it makes it that much easier. In the past, employees working from their personal devices was a recipe for leaked data.

But not anymore! Working with the SharePoint team, we’ve created a great new feature in the conditional access experience that I think you’re going to love: the ability to limit a user’s ability to download, print and sync based on the state of their device.

To tell you more about it, I’ve invited one of my program managers, Nitika Gupta, to write a blog, which you’ll find below. Read up, try things out, and let us know what you think!

Best regards,

Alex Simons (Twitter: @Alex_A_Simons)

Director of Program Management

Microsoft Identity Division

—-

Hi folks,

I’m Nitika Gupta, a Program Manager in the Identity Security and Protection team at Microsoft. Today we are announcing the public preview of a feature that will enhance security for SharePoint and OneDrive access while still helping maintain productivity.

Microsoft Intune and Azure Active Directory conditional access provides the ability to grant or block access to resources based on device state. This helps organizations ensure content doesn’t get on to a machine that isn’t encrypted, locked, secure from malware, etc. This is an important aspect of securing company data.

Unfortunately, not all devices can be managed. Sometimes people need to work from home computers, personal devices, or shared machines that aren’t enrolled. Until now, this meant losing productivity by denying access to SharePoint altogether or allowing unsecured download of content. Because of this, IT admins struggle to find the balance when configuring policies to prevent data leakage of corporate resources while ensuring that employees remain productive.

But what if we could have great user productivity and maintain a great security posture? That’s what the Secure, Productive Enterprise is all about and why I am thrilled to announce the public preview of the “Limited Access to SharePoint and OneDrive” feature! Now you can allow access to SharePoint and OneDrive from an unmanaged device by granting browser-only access with download, print, and sync disabled. Users can stay productive, and you can be assured that when they sign off, no data is leaked onto the unmanaged device.

Let me show you how it works in Azure AD Conditional Access and SharePoint!

Getting started

Configuring limited browser-only access to SharePoint and OneDrive is an easy two-step process. See our limited access documentation for more detailed instructions.

  1. First create an Azure AD Conditional access policy for SharePoint that applies only to browser client apps with “use app enforced restrictions” as the session control.

    Tip: To prevent users from going around the browser policy and accessing resources from mobile and desktop applications on unmanaged devices, we recommend enabling Azure AD conditional access policy. This enables access from mobile and desktop apps only from a compliant or domain joined device.

  2. Next, go to device access in the SharePoint admin center and select the checkbox to “Allow limited access (web-only, without the Download, Print, and Sync commands)”

Note: It can take up to 15 minutes for policy changes to take effect.

End user experience

When accessing SharePoint and OneDrive from devices that are not compliant or domain joined, end users will see a warning banner explaining why their experience is limited.

Feedback

We would love to hear your feedback! If you have any suggestions for us, questions, or issues to report, please leave a comment at the bottom of this post, or tweet with the hashtag #AzureAD.

Thanks,

Nitika Gupta

@_nitika_gupta

Live Unit Testing in Visual Studio 2017 Enterprise

$
0
0

Live Unit Testing is present in the Enterprise edition of Visual Studio 2017 and it’s available for C# and VB projects that target the .NET Framework. This is a more comprehensive blog than the one we published in November. In this blog, we focus on all capabilities including some that were not mentioned in the earlier blog. It also includes an updated video that demos all these capabilities. FAQsare covered as well at the end.

This is a productivity feature, which provides real-time feedback directly in the editor on how code changes are impacting your unit tests and your code coverage. This will help you maintain quality by keeping the tests passing as you make changes. It will also remind you when you need to write additional unit tests as you are making bug fixes and adding features.

The Live Unit Testing capabilities in Visual Studio 2017 Enterprise are highlighted below:

image1-live-unit-testing

Easy to Start, Stop, Pause or Restart

To enable Live Unit Testing, go to the Test command of the top-level menu bar, choose “Live Unit Testing”, then “Start”:

image2-live-unit-testing-start

At any time, you can temporarily pause or completely stop Live Unit Testing; for example, when you are in the middle of a refactoring, and you know that your tests will be broken for a while. It is as simple as opening the Test menu, selecting Live Unit Testing, and choosing one of the following options:

  • Pause to suspend Live Unit Testing. When Live Unit Testing is paused, you do not see any coverage visualization in the editor, but all the data that is collected so far is preserved. When you are ready to resume, select Continue from the Live Unit Testing menu. Live Unit Testing will do the necessary work to catch up with all the edits that have been made while it was paused and will update the glyphs appropriately.
  • Stop to completely stop Live Unit Testing. When Live Unit Testing is started after it had been stopped, it takes longer to show the glyphs than when it was paused and resumed. This is because it loses all data when it is stopped.
  • Restart is the equivalent to selecting Stop and immediately selecting Start to start Live Unit Testing again.

View coverage information in the editor as you type

Once enabled, Live Unit Testing helps you quickly see whether the code you’re writing is covered and if the tests that cover it are passing without leaving the editor.  Unit test results and coverage visualizations appear on a line-by-line basis in the code editor.

There are three potential states for any given line:

image4-live-unit-testing-coverage-state-redcrossA line of executable code that is covered by at least one failing test is decorated with a red “x”.
image5-live-unit-testing-coverage-state-greencheckA line of executable code that is covered by only passing tests is decorated with a green “✓”.
image6-live-unit-testing-coverage-state-bluedashA line of executable code that is not covered by any test is decorated it with a blue dash “-”

Live Unit Testing coverage visualization is updated immediately as you modify code in the code editor. While processing the edits, visualization changes to indicate that the data is not up-to-date, as shown below. Once processing is done, it transitions to one of the final states described earlier:

Quickly navigate to failed test

At any point in time you can hover over the “✓” or “x” to see how many tests are hitting the given line, as seen in image below:

image10-live-unit-testing-mouse-hover-tool-tip

To see what tests are exercising the given line, click on “✓” or “x”.

image11-live-unit-testing-mouse-click-tool-tip

When you hover over the failed test in the tool tip, it expands to provide additional info to give more insight into the failure:

image12-live-unit-testing-mouse-hover-over-test

To navigate directly to the failed test, click on it in the expanded UI.

Seamlessly debug failed test, edit and continue without having to restart

From the failed test, you can easily debug to the product code, make edits, and continue, without having to pause or stop Live Unit Testing. However, if you want Live Unit Testing to pause when you are debugging then there is an option in Tools/Options page, as shown in section 7 below, for Live Unit Testing to do that.

Include/Exclude targeted test methods or projects for large solutions

Live unit testing enables you to avoid the overhead of continuously running the unit tests for code that you aren’t touching or affecting, especially when you are dealing with a large code base. When you enable Live Unit Testing on a solution with 10 or more projects, you will see a dialog box, that gives a choice to include all or exclude all projects:

image13-live-unit-testing-large-solution

If you select Yes, you get coverage for all projects. If you select No, then Live Unit Testing excludes all projects from Live Unit Testing. You can then go ahead and include targeted tests, by right clicking a test project in solution explorer and choosing Live Tests/Include:

image14-live-unit-testing-include-exclude

The smallest unit of inclusion in or exclusion from Live Unit Testing is a test method.

You can also include or exclude tests by right-clicking in the code editor:

  • If you right click anywhere inside the method then that method can be included or excluded.
  • If you right click outside the method body but somewhere inside the containing class, then all tests inside that class can be included or excluded.
  • If you right click outside the class but somewhere inside the file, then all tests in that file can be included or excluded.

The last include/exclude action always wins. If you had explicitly excluded some tests within a class and go back to it later and include the entire containing class, then all tests inside that class will get included. This includes the tests that were previously explicitly excluded.

Include/Exclude state is saved as a user setting and is remembered when a solution is closed and reopened.

See FAQs section below for more information on how to exclude tests.

Integrated with Test Explorer

The Test Explorer Window and Live Unit Testing are synchronized. As you change your code, Live Unit Testing runs the impacted tests, and only those Tests are shown bright in the Test Explorer Window. The non-impacted tests are dimmed out as shown in image below:

image15-live-unit-testing-test-explorer-integration

Configurable with Tools/Options/Settings

To configure the available options for Live Unit Testing go to Visual Studio’s Options from the Tools menu, and select Live Unit Testing in the left pane of the Options dialog. The configurable options include:

  • Whether Live Unit Testing runs automatically when a solution is opened.
  • Whether Live Unit Testing pauses when a solution is built and debugged, or when a system’s battery power falls below a specified threshold.
  • The interval after which a test case times out; the default is 30 seconds.
  • The number of test processes that Live Unit Testing would create.
  • The Live Unit Testing log information written to the output window. Options include no logging (None), error messages only (Error), error and informational messages (Info – this is the default), or all detail (Verbose).

image16-tools-options

Adaptable to work with three popular unit testing frameworks

Live Unit Testing in Visual Studio works with three popular unit testing frameworks: MSTest, xUnit.net, and NUnit. The adapters and frameworks referenced in every project in the solution must meet or exceed the minimum versions given below else Live Unit Testing will give an error. You can get these from NuGet.org.

Test FrameworkVS Adapter VersionFramework version
xUnit.netxunit.runner.visualstudio version 2.2.0-beta3-build1187xunit 2.0
NUnitNUnit3TestAdapter version 3.5.1NUnit version 3.5.0
MSTestMSTest.TestAdapter 1.1.4-previewMSTest.TestFramework 1.0.5-preview

If you have older adapter and test framework references from your existing projects, be sure to remove them (make sure you remove the reference to Microsoft.VisualStudio.QualityTools.UnitTestFramework, if you are using MSTest.)  and add the new ones for Live Unit Testing to work.

FAQs

You can find latest Live Unit Testing FAQs on our MSDN documentation wiki.

Q: Does Live Unit Testing work with .NET Core?

A:  Live Unit Testing currently does not work with .NET Core. We are working to add this support in future.

Q: Why doesn’t Live Unit Testing work when I turn it on?

A: Output Window (when Live Unit Testing drop down is selected) should tell you why Live Unit Testing is not working. Live Unit testing may not work because of one of the following reasons:

  • If NuGet packages referenced by the projects in the solution have not been restored, then Live Unit Testing will not work. Doing an explicit build of the solution or restoring NuGet packages on the solution before turning Live Unit Testing on should resolve this issue.
  • If you are using MSTest-based tests in your projects, make sure that you remove the reference to Microsoft.VisualStudio.QualityTools.UnitTestFramework and add references to the latest MSTest NuGet packages (see above under the “Adaptable to work with three popular unit testing frameworks” section).
  • At least one project in your solution should have either a NuGet reference or direct reference to xUnit, NUnit or MSTest test framework. This project should also reference corresponding VS test adapters NuGet package. VS test adapter can also be referenced through a .runsettings file. The .runsettings file will need to have an entry like the one below:


<TestAdaptersPaths>c:\Path\To\Your\TestAdapter\TestAdaptersPaths>

Q:Can I customize my Live Unit Testing builds?

A: If your solution requires custom steps to build for instrumentation (Live Unit Testing) that are not required for the “regular” non-instrumented build, then you can add code to your project or .targets files that checks for the BuildingForLiveUnitTesting property and performs custom pre/post build steps. You can also choose to remove certain build steps (like publishing or generating packages) or to add build steps (like copying prerequisites) to a Live Unit Testing build based on this project property. This will not alter your regular build in any way and will only impact Live Unit Testing builds. For e.g., there may be a target which produces NuGet packages during a regular build. You probably do not want NuGet packages to be generated after every edit you make. So, you can disable that target in Live Unit Testing build by doing something like the following:


Q: Why do I get the following error when Live Unit Testing tries to build my solution “… appears to unconditionally set ‘’ or ‘’. Live Unit Testing will not execute tests from the output assembly”?

A: This can happen if the build process for your solution unconditionally overrides the or such that it does not fall under . In such cases, Live Unit Testing will not work because it also overrides these to ensure that build artifacts are dropped to a folder under . If you must override the location where you want your build artifacts to be dropped in a regular build, then override the conditionally and based on . For e.g. if your build is overriding the as shown below:


$(SolutionDir)Artifacts\$(Configuration)\bin\$(MSBuildProjectName)

Then you can replace it with the text below:


$(SolutionDir)Artifacts\$(Configuration)\bin\$(MSBuildProjectName)\
$(BaseOutputPath)

This ensures that lies within the folder.

Do not override directly in your build process; override instead for build artifacts to be dropped to a specific location.

Q: I want the artifacts of a Live Unit Testing build to go to a specific location instead of the default location under the .vs folder. How can I change that?

A: Set the LiveUnitTesting_BuildRoot user level environment variable to the path where you want the Live Unit Testing build artifacts to be dropped.

Q: How is running tests from Test Explorer window different from running tests in Live Unit Testing?

A: There are several differences:

  • Running or debugging tests from the Test Explorer window runs regular binaries, whereas Live Unit Testing runs instrumented binaries. If you want to debug instrumented binaries, adding a Launch method call in your test method causes the debugger to launch whenever that method is executed (including when it is executed by Live Unit Testing), and you can then attach and debug the instrumented binary. However, our hope is that instrumentation is transparent to you for most user scenarios, and you do not need to debug instrumented binaries.
  • Live Unit Testing does not create a new AppDomain to run tests, but tests run from the Test Explorer window do create a new AppDomain.
  • Live Unit Testing runs tests in each test assembly sequentially, whereas if you run multiple tests from the Test Explorer window and you selected the Run Tests in Parallel button, they will run in parallel.
  • Discovery and execution of tests in Live Unit Testing goes through version 2 of TestPlatform, whereas the Test Explorer window still uses version 1. You should not notice a difference in most cases though.
  • Test Explorer currently runs tests in a single-threaded apartment (STA) by default, whereas Live Unit Testing runs tests in a multithreaded apartment (MTA). To have MSTest tests run in STA in Live Unit Testing, decorate the test method or the containing class with the or attribute that can be found in the MSTest.STAExtensions 1.0.3-beta NuGet package. For NUnit, decorate the test method with the < RequiresThread(ApartmentState.STA)> attribute, and for xUnit, with the attribute.
Q: How do I exclude tests from participating in Live Unit Testing?

A: Please refer to include/exclude functionality mentioned above for user specific setting. This is extremely useful when you want to run a specific set of tests for a particular edit session or to persist your own personal preferences.  For solution specific settings, you can apply the ExcludeFromCodeCoverageAttribute programmatically to exclude methods, properties, classes, or structures from getting instrumented by Live Unit Testing. Additionally, you can also set property to “true” in your project file, to exclude the whole project from getting instrumented. The tests which have not been instrumented will still be run by Live Unit Testing but coverage from those will not be visualized.

You can check if “Microsoft.CodeAnalysis.LiveUnitTesting.Runtime” is loaded in the current AppDomain and disable tests based on that. For e.g. you could do something like the following with xUnit:

[ExcludeFromCodeCoverage]
public class SkipLiveFactAttribute : FactAttribute
{
private static bool s_lutRuntimeLoaded = AppDomain.CurrentDomain.GetAssemblies().Any(a => a.GetName().Name == "Microsoft.CodeAnalysis.LiveUnitTesting.Runtime");
public override string Skip => s_lutRuntimeLoaded ? "Test excluded from Live Unit Testing" : "";
}
public class Class1
{
[SkipLiveFact]
public void F()
{
Assert.True(true);
}
}
Q: Why are Win32 PE headers different in instrumented assemblies built by Live Unit testing?

A: There is a known bug that may result in Live Unit Testing builds failing to embed the following Win32 PE Header data. Tests that rely on these values may fail when executed by Live Unit testing:

  • File Version (specified by AssemblyFileVersionAttribute in code)
  • Win32 Icon (specified by /win32icon: on command line)
  • Win32 Manifest (specified by /win32manifest: on command line)
Q: Why does Live Unit testing keep building my solution all the time even if I am not making any edits?

A: This can happen if the build process of your solution generates code which are part of the solution itself, and your build target files do not have appropriate inputs and outputs specified. Targets should be given a list of inputs and outputs so that MSBuild can perform the appropriate up-to-date checks and determine whether a new build is required. Live Unit Testing will kick off a build whenever it detects that source files have changed. Because the build of your solution generates source files, Live Unit Testing will get into infinite build loop. If, however the inputs and outputs of the target are checked then when Live Unit Testing starts the second build (after detecting the newly generated source files from previous build), it will break out of the loop because the inputs and outputs checks will indicate that everything is up-to-date.

Q: How does Live Unit testing work with the Lightweight Solution Load feature?

A: Live Unit Testing currently doesn’t work well with the Lightweight Solution load feature if all projects in the solution are not yet loaded. You may get incorrect coverage information in such scenarios.

Q: Why does Live Unit Testing does not capture coverage from a new process created by a test?

A: This is a known issue which we were not able to fix in VS 2017 release. It should be fixed in a subsequent update of VS 2017.

Q: Why does nothing happen after I include or exclude tests from Live Test Set?

A: This is a known issue. To work around this, you will need to make an edit on any file after you have included or excluded tests.

Q: Why do I not see any icons in the editor even though Live Unit Testing seems to be running the tests based on the messages in the output window?

A: This will happen if the assemblies that Live Unit Testing is operating upon is not instrumented for any reason. For e.g. Live Unit Testing is not compatible with projects that set false. In this case, your build process will need to be updated to either not set this or change it to false for Live Unit Testing to work.

Q: How do I collect more detailed logs to file bug reports?

A: You can do several things to collect more detailed logs:

  • Go to Tools > Options > Live Unit Testing and change the logging option to verbose. This causes more detailed logs to be shown in the output window.
  • Set the LiveUnitTesting_BuildLog user environment variable to the path of the file you want to use to capture the MSBuild log. Detailed MSBuild log messages from Live Unit Testing builds can then be retrieved from this file.
  • Create a user-level environment variable named VS_UTE_DIAGNOSTICS and set it to 1 (or any value) and restart Visual Studio. Now you should see lots of logging in the Output – Tests tab in Visual Studio.

Conclusion

Live Unit Testing will improve your productivity, test coverage and software quality. .NET developers, check out this feature in Visual Studio 2017. For developers who are part of a team that practices test-driven development, Live Unit Testing gamifies their workflow; in other words, all their tests will fail at first, and as they implement each method, they will see them turn green. It will evoke the same feeling as a nod of approval from your coach, who is watching you intently from the sidelines, as you practice your art!

Watch this Live Unit Testing video, where we demonstrate this feature:


Joe Morris, Senior Program Manager, Visual Studio
@_jomorrisJoe has been with Microsoft for 19 years, with a particular focus on static analysis and developer productivity for the last three years.
Manish Jayaswal, Principal Engineering Manager, Visual Studio

Manish has years of management experience in commercial software development with deep technical expertise in compiler technology, debugger, programming languages, quality assurance and engineering system.

Playable Ads – Acquire Users Who Love to Engage with Your App

$
0
0

We are happy to announce the launch of the preview of Playable Ads in the Windows Dev Center. We have made several ground-breaking enhancements in the way users interact with ads so that developers can acquire the users who are more engaged and proven to be more profitable.

What are Playable Ads?

Let us first understand how the current ad campaigns work. Every time a user clicks on the app install ad, he/she is taken to the Windows store page, leaving the current app to decide whether to install the respective app. The information contained in the product description page is not always complete and the experience a user can get from the actual app usage can potentially differ a lot. This sometimes leads to a quick uninstall if the promise of the product description pages is not met.

Playable Ads are a completely new way for end users to interact with ads and apps. With this capability, end users never leave the current app. The ad click will result in inlineexpandable app streaming: for three minutes, the user can interact with the app as if it’s already installed on his/her device. This gives the user time to decide if he or she wants to install the app. At the end of the streaming session, users can click on a link to install the app if the app experience met expectations.

Difference between Regular Ads and Playable Ads

Why are these ads better?

Playable ads have many advantages for both the end users and developers, some of which are listed below:

  • Users can experience the app live before installing it.
  • Users will not leave the current app context after ad click since these are inline expandable ads.
  • Users can abandon the app stream at any point of time based on the quality of the game. He/she is not blocked until the end of the game play.
  • Developers can create an engaging experience during the first few minutes of a game to better explain its capabilities compared to screenshots.
  • Users who install the game after three minutes of engagement are more inclined to use the game/app than those who just installed the app based on the product description page.

And finally, we believe that users acquired via playable ads will have a higher life time value compared with users acquired through the regular channels.

Great! Do I have to do anything as an app developer?

This is the best part of the feature. As an end developer, you don’t have to do anything! No new packages, nothing. Microsoft does all the background work to give a seamless experience to the end users without you, the developer, having to change anything.

How do I create these ads?

If you haven’t already used the app promotion capability, follow these steps to create a new ad campaign:

  • Click on the “Dashboard” after your log in to your Windows Dev Center account.
  • Click on the “Promotions” tab under the Main menu.
  • Click on “New Campaign” to create a new user acquisition campaign.

If the targeting criteria is set to PC/Tablet for the Device type & Windows 10 as the OS, the creative section will show a new call to action called ‘Try Now.’ All the ad campaigns created with ‘Try Now’ as the call to action are automatically created as ‘Playable Ad’ campaigns on the back-end with app streams.

This feature is currently open under a limited preview. If you are interested in using this capability, please reach us at aiacare@microsoft.com.

The post Playable Ads – Acquire Users Who Love to Engage with Your App appeared first on Building Apps for Windows.

Tech Tip Thursday: Embed a dashboard into your application

$
0
0
A couple of weeks ago we enabled embedding Power BI dashboards into your business applications. This week, Guy in a Cube walks through the process of embedding the dashboard, using the public developer samples, the Power BI REST API, and the JavaScript API. See how to start monitoring your business in the context of your current applications!

Episode 121 with Richard Moe on Microsoft Teams Extensibility—Office 365 Developer Podcast

$
0
0

In episode 121 of the Office 365 Developer Podcast, Richard diZerega and Andrew Coates are joined by Richard Moe, the Developer Community Program Manager for Microsoft Teams to discuss the launch of Microsoft Teams and the developer story with it.

Download the podcast.

Weekly updates

Show notes

Got questions or comments about the show? Join the O365 Dev Podcast on the Office 365 Technical Network. The podcast RSS is available on iTunes or search for it at “Office 365 Developer Podcast” or add directly with the RSS feeds.feedburner.com/Office365DeveloperPodcast.

About Richard Moe

Richard heads up the Microsoft Teams Extensibility developer community, where he helps champion and support partners building to extend Microsoft Teams via rich Tabs and Bots. His route to this role took a circuitous path, most recently as a Evangelist on DX supporting ISVs and before that helping launch the Microsoft Studios game portfolio launch on Windows. In fact, the majority of his career has been in the games industry, from Facebook to mobile games, as engineer, designer and everything in between.

About the hosts

RIchard diZeregaRichard is a software engineer in Microsoft’s Developer Experience (DX) group, where he helps developers and software vendors maximize their use of Microsoft cloud services in Office 365 and Azure. Richard has spent a good portion of the last decade architecting Office-centric solutions, many that span Microsoft’s diverse technology portfolio. He is a passionate technology evangelist and a frequent speaker at worldwide conferences, trainings and events. Richard is highly active in the Office 365 community, popular blogger at aka.ms/richdizz and can be found on Twitter at @richdizz. Richard is born, raised and based in Dallas, TX, but works on a worldwide team based in Redmond. Richard is an avid builder of things (BoT), musician and lightning-fast runner.


ACoatesA Civil Engineer by training and a software developer by profession, Andrew Coates has been a Developer Evangelist at Microsoft since early 2004, teaching, learning and sharing coding techniques. During that time, he’s focused on .NET development on the desktop, in the cloud, on the web, on mobile devices and most recently for Office. Andrew has a number of apps in various stores and generally has far too much fun doing his job to honestly be able to call it work. Andrew lives in Sydney, Australia with his wife and two almost-grown-up children.

Useful links

StackOverflow

Yammer Office 365 Technical Network

The post Episode 121 with Richard Moe on Microsoft Teams Extensibility—Office 365 Developer Podcast appeared first on Office Blogs.

Viewing all 13502 articles
Browse latest View live


<script src="https://jsc.adskeeper.com/r/s/rssing.com.1596347.js" async> </script>