Quantcast
Channel: TechNet Technology News
Viewing all 13502 articles
Browse latest View live

Microsoft Azure Stack ecosystem expands with the introduction of Cisco integrated system

$
0
0

This post was authored by the Microsoft Azure Stack team.

We shared our goal of expanding the Azure Stack ecosystem to offer you more choice and flexibility of hardware options for your IT landscape. Today, Cisco announced a jointly engineered Cisco Integrated System for Microsoft Azure Stack. With this announcement, we are taking one more step towards our goal.

Through our technical previews, we have seen customers unlock various hybrid cloud use-cases by using Azure Services across cloud and on-premises environments, building applications using a consistent approach, and deploying them to the location that best meets their needs. Now, you can make technology decisions based on business requirements, rather than business decisions based on technology complications. To best meet your requirements, we have focused on two parallel areas of investments adding features and functionality to the Azure Stack platform, and growing a diverse partner ecosystem so you have a wide array of Azure stack offerings, solutions, and services that best match your needs.

To this effect, the joint Microsoft and Cisco announcement today brings together Microsofts Azure Stack and Ciscos robust UCS platform, which helps reduce the complexity of delivering and operating hybrid cloud solution on-premises. This approach enables you to focus on delivering high quality service levels for business applications rather than focusing on infrastructure management. Cisco Integrated System for Microsoft Azure Stack is planned to be available in Q3 2017.

As always, tell us what you think and keep up the discussion in our UserVoice community.


Extreme 25x compression of JSON data using CLUSTERED COLUMNSTORE INDEXES

$
0
0

CLUSTERED COLUMNSTORE INDEXES (CCI) provide extreme data compression. In Azure SQL Database and SQL Server vNext you can create CCI on tables with NVARCHAR(MAX) columns. Since JSON is stored as NVARCHAR type, now you can store huge volumes of JSON data in tables with CCI. In this post, I will show you how you can get 25x compression on a table that contains JSON/NVARCHAR(MAX) column using CCI.

In this experiment, I will use publicly available ContosoDW database where we have FactOnlineSales table with 12 million records. This fact table is related to a number of dimension tables such as DimStore, DimCustomer, DimProduct, etc., as it is shown on the following figure:

contosodwsales


Imagine that all these related tables are stored in NoSQL-style as a single JSON document. In that case we would have a single table that will have some Data NVARCHAR(MAX) column where we would store data from all related tables as JSON text – something like:

DROP TABLE IF EXISTS SalesRecords
GO
CREATE TABLE SalesRecords(
 OrderNumber nvarchar(20) not null,
 ProductKey int not null,
 StoreKey int not null,
 Date datetime not null,
 CustomerKey int not null,
 Data nvarchar(max) not null,
 INDEX cci CLLUSTERED COLUMNSTORE
)

In this example, I will keep int key columns as separate columns and store all other columns from FactOnlineSales table and all columns from the related tables in a single Data column. The query that will de-normalize all related dimensions into a single column is shown below:

INSERT INTO SalesRecords(OrderNumber, StoreKey, ProductKey, Date, CustomerKey, Data)
SELECT FactOnlineSales.SalesOrderNumber, FactOnlineSales.StoreKey, FactOnlineSales.ProductKey, FactOnlineSales.DateKey, FactOnlineSales.CustomerKey,
 FactOnlineSales.PromotionKey, 
 FactOnlineSales.SalesOrderLineNumber, FactOnlineSales.SalesQuantity, FactOnlineSales.SalesAmount, FactOnlineSales.CurrencyKey, 
 FactOnlineSales.ReturnQuantity, FactOnlineSales.ReturnAmount, FactOnlineSales.DiscountQuantity, FactOnlineSales.DiscountAmount, FactOnlineSales.TotalCost, 
 FactOnlineSales.UnitCost, FactOnlineSales.UnitPrice,
 DimProduct.ProductName AS [Product.Name], DimProduct.ProductDescription AS [Product.Description], DimProduct.Manufacturer AS [Product.Manufacturer], 
 DimProduct.BrandName AS [Product.Brand], DimProduct.ClassName AS [Product.Class], DimProduct.StyleName AS [Product.Style], 
 DimProduct.ColorName AS [Product.Color], DimProduct.Size AS [Product.Size], DimProduct.SizeRange AS [Product.SizeRange], 
 DimProduct.Weight AS [Product.Weight], DimProduct.UnitCost AS [Product.UnitCost], DimProduct.UnitPrice AS [Product.UnitPrice], 
 DimProduct.ImageURL AS [Product.ImageURL], DimProduct.ProductURL AS [Product.URL], 
 DimProductSubcategory.ProductSubcategoryLabel AS [Product.SubcategoryLabel], DimProductSubcategory.ProductSubcategoryName AS [Product.SubcategoryName], 
 DimProductSubcategory.ProductSubcategoryDescription AS [Product.SubcategoryDescription], DimProductCategory.ProductCategoryLabel AS [Product.CategoryLabel], 
 DimProductCategory.ProductCategoryName AS [Product.CategoryName], DimProductCategory.ProductCategoryDescription AS [Product.CategoryDescription], 
 DimCustomer.CustomerLabel AS [Customer.Label], DimCustomer.Title AS [Customer.Title], DimCustomer.FirstName AS [Customer.FirstName], 
 DimCustomer.MiddleName AS [Customer.MiddleName], DimCustomer.LastName AS [Customer.LastName], DimCustomer.NameStyle AS [Customer.NameStyle], 
 DimCustomer.BirthDate AS [Customer.BirthDate], DimCustomer.MaritalStatus AS [Customer.MaritalStatus], DimCustomer.Suffix AS [Customer.Suffix], 
 DimCustomer.Gender AS [Customer.Gender], DimCustomer.EmailAddress AS [Customer.EmailAddress], DimCustomer.YearlyIncome AS [Customer.YearlyIncome], 
 DimCustomer.TotalChildren AS [Customer.TotalChildren], DimCustomer.NumberChildrenAtHome AS [Customer.NumberChildrenAtHome], 
 DimCustomer.Education AS [Customer.Education], DimCustomer.Occupation AS [Customer.Occupation], 
 DimCustomer.HouseOwnerFlag AS [Customer.HouseOwnerFlag], DimCustomer.AddressLine1 AS [Customer.AddressLine1], 
 DimCustomer.NumberCarsOwned AS [Customer.NumberCarsOwned], DimCustomer.AddressLine2 AS [Customer.AddressLine2], 
 DimCustomer.Phone AS [Customer.Phone], DimCustomer.CompanyName AS [Customer.CompanyName], DimGeography_1.CityName AS [Customer.CityName], 
 DimGeography_1.StateProvinceName AS [Customer.StateProvinceName], DimGeography_1.RegionCountryName AS [Customer.RegionCountryName], 
 DimGeography_1.ContinentName AS [Customer.ContinentName], DimGeography_1.GeographyType AS [Customer.GeographyType], 
 JSON_QUERY(CONCAT('{"type": "Feature","geometry": {"type": "Point","coordinates": [',DimGeography_1.Geometry.STX,',', DimGeography_1.Geometry.STY,']}}')) AS [Customer.Geometry],
 DimCurrency.CurrencyName AS [Currency.Name], DimCurrency.CurrencyDescription AS [Currency.Description], 
 DimCurrency.CurrencyLabel AS [Currency.Label], DimPromotion.PromotionLabel AS [Promotion.Label], DimPromotion.PromotionName AS [Promotion.Name], 
 DimPromotion.PromotionDescription AS [Promotion.Description], DimPromotion.DiscountPercent AS [Promotion.DiscountPercent], 
 DimPromotion.PromotionType AS [Promotion.Type], DimPromotion.PromotionCategory AS [Promotion.Category], DimPromotion.StartDate AS [Promotion.StartDate], 
 DimPromotion.EndDate AS [Promotion.EndDate], DimPromotion.MinQuantity AS [Promotion.MinQuantity], DimPromotion.MaxQuantity AS [Promotion.MaxQuantity], 
 DimStore.StoreName AS [Store.Name], DimStore.StoreDescription AS [Store.Description], DimStore.StoreManager AS [Store.Manager], 
 DimStore.StoreType AS [Store.Type], DimStore.Status AS [Store.Status], DimStore.OpenDate AS [Store.OpenDate], DimStore.CloseDate AS [Store.CloseDate], 
 DimStore.ZipCode AS [Store.ZipCode], DimStore.ZipCodeExtension AS [Store.ZipCodeExtension], DimStore.StorePhone AS [Store.Phone], 
 DimStore.StoreFax AS [Store.Fax], DimStore.AddressLine1 AS [Store.AddressLine1], DimStore.AddressLine2 AS [Store.AddressLine2], 
 JSON_QUERY(CONCAT('{"type": "Feature","geometry": {"type": "Point","coordinates": [',DimStore.Geometry.STX,',', DimStore.Geometry.STY,']}}')) AS [Store.Geometry], 
 JSON_QUERY(CONCAT('{"type": "Feature","geometry": {"type": "Point","coordinates": [',DimStore.GeoLocation.STX,',', DimStore.GeoLocation.STY,']}}')) AS [Store.GeoLocation], 
 JSON_QUERY(dbo.geometry2json(DimStore.Geometry)) AS [Store.Geometry], DimGeography.CityName AS [Store.CityName], 
 DimGeography.StateProvinceName AS [Store.StateProvinceName], DimGeography.RegionCountryName AS [Store.RegionCountryName], 
 DimGeography.ContinentName AS [Store.ContinentName], DimGeography.GeographyType AS [Store.GeographyType],
 JSON_QUERY(CONCAT('{"type": "Feature","geometry": {"type": "Point","coordinates": [',DimGeography.Geometry.STX,',', DimGeography.Geometry.STY,']}}')) AS [Store.Geo.Location], 
 DimGeography.GeographyKey AS [Store.GeographyKey], DimEntity.EntityLabel AS [Store.Entity.Label], 
 DimEntity.EntityName AS [Store.Entity.Name], DimEntity.EntityDescription AS [Store.Entity.Description], DimEntity.EntityType AS [Store.Entity.Type], 
 DimEntity.Status AS [Store.Entity.Status], DimDate.FullDateLabel AS [Date.FullDateLabel], DimDate.DateDescription AS [Date.DateDescription], 
 DimDate.CalendarYear AS [Date.CalendarYear], DimDate.CalendarMonthLabel AS [Date.CalendarMonthLabel], DimDate.FiscalYear AS [Date.FiscalYear], 
 DimDate.FiscalMonth AS [Date.FiscalMonth], DimDate.FiscalYearLabel AS [Date.FiscalYearLabel], DimDate.CalendarYearLabel AS [Date.CalendarYearLabel], 
 DimDate.CalendarHalfYear AS [Date.CalendarHalfYear], DimDate.CalendarHalfYearLabel AS [Date.CalendarHalfYearLabel], DimDate.Datekey AS [Date.Datekey], 
 DimDate.CalendarQuarter AS [Date.CalendarQuarter], DimDate.CalendarQuarterLabel AS [Date.CalendarQuarterLabel], 
 DimDate.CalendarMonth AS [Date.CalendarMonth], DimDate.CalendarWeek AS [Date.CalendarWeek], DimDate.CalendarWeekLabel AS [Date.CalendarWeekLabel], 
 DimDate.CalendarDayOfWeekLabel AS [Date.CalendarDayOfWeekLabel], DimDate.CalendarDayOfWeek AS [Date.CalendarDayOfWeek], 
 DimDate.FiscalHalfYear AS [Date.FiscalHalfYear], DimDate.FiscalHalfYearLabel AS [Date.FiscalHalfYearLabel], DimDate.FiscalQuarter AS [Date.FiscalQuarter], 
 DimDate.FiscalQuarterLabel AS [Date.FiscalQuarterLabel], DimDate.FiscalMonthLabel AS [Date.FiscalMonthLabel]

FROM FactOnlineSales INNER JOIN
 DimDate ON FactOnlineSales.DateKey = DimDate.Datekey INNER JOIN
 DimStore ON FactOnlineSales.StoreKey = DimStore.StoreKey INNER JOIN
 DimProduct ON FactOnlineSales.ProductKey = DimProduct.ProductKey INNER JOIN
 DimPromotion ON FactOnlineSales.PromotionKey = DimPromotion.PromotionKey INNER JOIN
 DimCurrency ON FactOnlineSales.CurrencyKey = DimCurrency.CurrencyKey INNER JOIN
 DimCustomer ON FactOnlineSales.CustomerKey = DimCustomer.CustomerKey INNER JOIN
 DimGeography ON DimStore.GeographyKey = DimGeography.GeographyKey INNER JOIN
 DimProductSubcategory ON DimProduct.ProductSubcategoryKey = DimProductSubcategory.ProductSubcategoryKey INNER JOIN
 DimProductCategory ON DimProductSubcategory.ProductCategoryKey = DimProductCategory.ProductCategoryKey INNER JOIN
 DimGeography DimGeography_1 ON DimCustomer.GeographyKey = DimGeography_1.GeographyKey INNER JOIN
 DimEntity ON DimStore.EntityKey = DimEntity.EntityKey


I’m joining all related dimension tables, format them as JSON text using FOR JSON clause and loading everything into SalesRecords table. This query will populate a table with CCI index.

I will also create a copy of this table but without CCI (plain heap table) using the following query:

select *
 into SalesRecordsRS
 from SalesRecords

Now, I will compare sizes of the table with CCI and the table without CCI using the following query:

exec sp_spaceused 'SalesRecordsRS'
exec sp_spaceused 'SalesRecords'

The results of these queries are shown below:

contosodwsales-space-used

A table without CCI has 101.020.896 KB, while the table with CCI has only 4.047.128 KB in data column. With CCI we can compress 100GB table to 4GB with 24.96 compression ratio!

Compression is not important only for storage savings. The following query on a table with CCI this query is executed in 46 seconds, while on a heap table execution takes 13 min 45 seconds.

select min(datalength(data)), avg(datalength(data)), max(datalength(data))
 from SalesRecords

Smaller disk io and batch execution provided by CCI enables you to run 18x faster queries.

Conclusion

CLUSTERED COLUMNSTORE INDEXES provide extreme data compression in SQL Server and Azure SQL Database. With NVARCHAR(MAX) support in CCI indexes you can use them on your JSON data stored is database and get high 25x compression. Therefore, CCI is a perfect solution if you need to store a large volume of JSON data in your SQL Database.

ContosoDW database is publicly available for download, so you can use this database and the scripts from this post to try this in your environment.

Integrate Power BI reports in SharePoint Online

$
0
0
We’ve heard from customers that SharePoint Online is a critical part of their company’s data communication and dissemination strategy and that to-date it wasn’t easy to include Power BI content there. The feature we’re announcing today changes all that.

Join Us: Visual Studio 2017 Launch Event and 20th Anniversary

$
0
0

Twenty-five years ago, I started my first day at Microsoft as a developer on the Access team, and then as a developer on a newly created product – Visual InterDev. I remember how the emphasis was on the Visual partof our various product offerings, we have come a long way to the Visual Studio we have now.

Today, I’m proud and humbled that Visual Studio is turning twenty – we’re celebrating two decades of Visual Studio! As we hit this great milestone, I’m also excited to announce that Visual Studio 2017 will be released on March 7.

As part of the team that created the first version of Visual Studio, it was an ambitious goal to bring together everything developers needed to build applications for the client, the server, and the web. Twenty years ago, on January 28, 1997, we announced that we were going to launch Visual Studio 97 – a single product that would bring together best-of-breed productivity tools for any developer. This was no trivial undertaking. It was a challenging task to bring Visual Basic, Visual C++, Visual J++, Visual FoxPro, and Visual InterDev into one single development environment. The team delivered, kicking off decades of incredible productivity for millions of developers worldwide.

Over the years, Visual Studio grew from an IDE to a suite of products and services, including Visual Studio Team Services, Visual Studio Code, and many others. The family of Visual Studio products extends across platforms, enabling developers to build mobile-first, cloud-first apps that span Android, iOS, Linux, MacOS, and Windows. It also offers industry-leading DevOps practices across all types of projects, as well as tight integration with the Azure cloud.

On March 7, we are proud to bring you our newest release, Visual Studio 2017, with a livestreamed two-day launch event at https://launch.visualstudio.com. Brian Harry, Miguel de Icaza, and Scott Hanselman will join me on stage to share the latest innovations from Visual Studio, .NET, Xamarin, Azure, and more. You will have the opportunity to engage in demo packed sessions focusing on key improvements within the product. To help you get started, on March 8, we will also bring you a full-day of live training with multiple topics to choose from. Save the date.

Whether you’re new to Visual Studio or have been with us on this journey, we want to hear and share your story. Grab your phone and take a short video to tell us a little about your Visual Studio journey:

  • How long have you been using Visual Studio?
  • What is the coolest software you’ve built?
  • What do you like about Visual Studio?
  • How about birthday wishes? How would you say, “Happy Birthday, Visual Studio” in your native language?

Check out this example from Sara Ford:

What memorabilia have you collected over the years? Is it a sticker, t-shirt, mug, poster, button, or something else? Share a photo or a short video clip on Instagram or post your story on Twitter and Facebook using the hashtag #MyVSstory.

I look forward to hearing your stories!

Julia Liuson, Corporate Vice President, Visual Studio

Julia is responsible for developer tools and services, including the programming languages and runtimes designed for a broad base of software developers and development teams as well as for Visual Studio, Visual Studio Code, and the .NET Framework lines of products and services. Julia joined Microsoft in 1992, and has held a variety of technical and management positions while at Microsoft, including the General Manager for Visual Studio Business Applications, the General Manager for Server and Tools in Shanghai, and the development manager for Visual Basic.

Track your Office knowledge and skills with Office Training Roadmaps

$
0
0

Today, we are releasing Office Training Roadmaps to help your company set training expectations and track progress for six Office apps. The training roadmaps help you quickly find what you need to learn and are available both online and as printable posters for Office 365, Excel, Outlook, PowerPoint, Word and Access 2016.

Track your Office knowledge 1

Also, if you or your company needs help getting started with Office apps, we have expanded our Quick Start Guides to include Excel, Outlook and Sway. All of these free resources can be found at the Office Training Center.

—Lesley Alexander-McVie, program manager for the Office Learning team

The post Track your Office knowledge and skills with Office Training Roadmaps appeared first on Office Blogs.

The OneNote REST API now supports application-level permissions

$
0
0

The OneNote API team is pleased to announce that we have enabled application-level permissions support for the OneNote API. Until now, OneNote API calls could only be made with user-delegated permissions. This meant that your application would be restricted to scenarios that required a user to be signed in. With application-level permissions support, your application now supports scenarios that do not require a user to be signed in! Read the MSDN article for details of the OneNote API application-level permissions support.

With the availability of OneNote API application-level permissions support, many new scenarios that weren’t possible earlier are now enabled. Some example scenarios include:

  • Analytics (based on OneNote metadata and content exposed by the OneNote API).
  • Dashboards (based on OneNote metadata and content exposed by the OneNote API).
  • Background provisioning of OneNote content.
  • Background update of OneNote content.

During the development process of building the new application-level permissions support for OneNote API, our Product Management and Engineering teams worked closely with third-party partners to ensure that relevant and key education scenarios were implemented. We also ensured that our API would work well with new and upcoming third-party solutions. One of these education companies we worked closely with during the API development was Hapara.

TheHapara Dashboard provides educators with a bird’s-eye view into student work across the Office 365 platform. With Dashboard, educators view and access student work from OneDrive and OneNote Class Notebooks from a central hub, making it easier to engage with students and their work across the Office 365 platform. Hapara relies on the new OneNote API to help co-teachers, counselors, coaches and school administrators gain appropriate access to student work in any classroom, something that previously required manual sharing and significant administrative effort by the individual teachers. Now, cross-school teams gain the same level of access and visibility into Class Notebooks via the Hapara Dashboard as teachers get via the OneNote Class Notebook app. This allows all to participate in serving students, while reducing the administrative burden on the teachers.”
—Nara Chilluvuri, product manager at Hapara

With the availability of application-level permissions support for OneNote API, solution providers, ISVs and IT admins can access important usage data about OneNote across a tenant, including:

  • Teacher usage of Class Notebooks.
  • Student usage of Class Notebooks.
  • Information about specific pages, sections or notebooks.
  • How many pages were touched and last time each page was touched.
  • Information about the Collaboration Space usage in the Class Notebook.
  • Information about OneNote Page content, including paragraphs, tables, images and attachments.

Creating a new application or updating your existing application to use the new application-level permissions support for OneNote API requires just a couple of additional (relative to using user-delegated permissions) steps. For step-by-step instructions, see the detailed OneNote app-only API documentation on MSDN.

—The OneNote team

The post The OneNote REST API now supports application-level permissions appeared first on Office Blogs.

Building a GitHub Dashboard using PowerShell, AzureStorageTable, AzureFunction, and PowerBI

$
0
0
Last week, I published a PowerShell Community Dashboard and today, I’m going to share the code and cover some of the learnings.The code is published as a module on the PowerShell Gallery.
Make sure you get v1.1 as I found an issue where if you’re not a member of the PowerShell Org on GitHub, you won’t have permission to query the members so I changed the code to accommodate that.You can install the module using:
install-module PSGitHubStats

(and it works on PowerShell Core 6.0 including Linux! I only tested it with alpha.15, though…)

Once installed, you can just run it manually:

PS C:\>Get-PSDownloadStats-publishedSinceDate 1-1-2017-accessToken $accesstoken

Tag             Name                                                 OS      Distro    Count Published
-----------------------------
v6.0.0-alpha.15 powershell-6.0.0-alpha.15.pkg                        MacOS   MacOS     15041/25/20177:25:52 PM
v6.0.0-alpha.15 powershell-6.0.0_alpha.15-1.el7.centos.x86_64.rpm    Linux   CentOS    4361/25/20177:25:52 PM
v6.0.0-alpha.15 powershell_6.0.0-alpha.15-1ubuntu1.14.04.1_amd64.deb Linux   Ubuntu14  3681/25/20177:25:52 PM
v6.0.0-alpha.15 powershell_6.0.0-alpha.15-1ubuntu1.16.04.1_amd64.deb Linux   Ubuntu16  9511/25/20177:25:52 PM
v6.0.0-alpha.15 PowerShell_6.0.0-alpha.15-win10-win2k16-x64.msi      Windows Windows10 3491/25/20177:25:52 PM
v6.0.0-alpha.15 PowerShell_6.0.0-alpha.15-win10-win2k16-x64.zip      Windows Windows10 701/25/20177:25:52 PM
v6.0.0-alpha.15 PowerShell_6.0.0-alpha.15-win7-win2k8r2-x64.msi      Windows Windows7  1191/25/20177:25:52 PM
v6.0.0-alpha.15 PowerShell_6.0.0-alpha.15-win7-win2k8r2-x64.zip      Windows Windows7  341/25/20177:25:52 PM
v6.0.0-alpha.15 PowerShell_6.0.0-alpha.15-win7-x86.msi               Windows Windows7  1921/25/20177:25:52 PM
v6.0.0-alpha.15 PowerShell_6.0.0-alpha.15-win7-x86.zip               Windows Windows7  171/25/20177:25:52 PM
v6.0.0-alpha.15 PowerShell_6.0.0-alpha.15-win81-win2k12r2-x64.msi    Windows Windows8  741/25/20177:25:52 PM
v6.0.0-alpha.15 PowerShell_6.0.0-alpha.15-win81-win2k12r2-x64.zip    Windows Windows8  211/25/20177:25:52 PM

PS C:\>$contributors=Get-PSGitHubReport-startDate 1-1-2017-repos powershell/powershell -accessToken $accesstoken
PS C:\>$contributors|? {$_.Org-eq"Community"} | sort -Property Total -Top 10-Descending

   Org: Community

Name             PRs               Issues           PR Comments      Issue Comments   Total            End Date---------------------------------------------------
iSazonov         8444461022017-02-0310...
vors             54126272017-02-0310...
thezim           0209112017-02-0310...
juneb            040482017-02-0310...
Jaykul           030582017-02-0310...
pcgeek86         030582017-02-0310...
jeffbi           000662017-02-0310...
MaximoTrinidad   020352017-02-0310...
g8tguy           000552017-02-0310...
mwallner         010342017-02-0310...

The $accesstoken is something you would generate and needed because the number of queries I have to do against the GitHub API will likely exceed the unauthenticated rate limit.
I ran over the rate limit many times while generating my report, even as an authenticated user. I solved this by adding a sleep command to the report generation.

One thing you may notice with the module vs the dashboard is that you get the raw numbers rather than just the rankings.
On the dashboard, we decided to only show the rankings so that people don’t focus specifically on the numbers.

Get-PSDownloadStats should be pretty straight forward.
There is some specialized logic in that function to determine the target operating system for the release package which unfortunately depends on the filename.

Publishing to AzureTable is fairly simple once you figure out the magic sauce to provide in the headers to make sure you’re calling the appropriate version of the REST API:

if($publishToAzure)
{$json=$pkg|ConvertTo-Json-Compress$date=[datetime]::UtcNow.ToString("R",[System.Globalization.CultureInfo]::InvariantCulture)[string]$canonicalizedResource="/$storageAccount/$storageTable"$contentType="application/json"[string]$stringToSign="POST`n`n$contentType`n$date`n$canonicalizedResource"$headers= @{"Prefer"="return-no-content";"Authorization"=(CreateAuthHeader -canonicalizedString $stringToSign-storageAccount $storageAccount-storageKey $storageKey);"DataServiceVersion"="3.0;NetFx";"MaxDataServiceVersion"="3.0;NetFx";"Accept"="application/json;odata=nometadata";"Accept-Charset"="UTF-8";"x-ms-version"="2013-08-15";"x-ms-date"=$date}$null=Invoke-RestMethod-Uri $storageUrl-Headers $headers-Body $json-Method Post -ContentType $contentType
}

I deliberately chose to use an AzureTable for a few reasons:

  • Power BI supports reading from AzureTable natively (although I think you can only do it from the Power BI desktop app) as I couldn’t find the option in the web interface
  • I didn’t need the relational capabilities nor the additional cost of AzureSQL for my purposes
  • I can import JSON directly into AzureTable

The most complicated part of working with AzureTable is correctly crafting the authentication header built from a canonicalized string AzureTable expects to protect against replay attacks.
The string is defined in the previous code section as $stringToSign while this bit of code hashes it and converts the result to Base64:

FunctionCreateAuthHeader([string]$canonicalizedString,[string]$storageAccount,[string]$storageKey)
{[string]$signature=[string]::Empty[byte[]]$bytes=[System.Convert]::FromBase64String($storageKey)[System.Security.Cryptography.HMACSHA256]$SHA256=New-Object System.Security.Cryptography.HMACSHA256(,$bytes)[byte[]]$dataToSha256=[System.Text.Encoding]::UTF8.GetBytes($canonicalizedString)$signature=[System.Convert]::ToBase64String($SHA256.ComputeHash($dataToSha256))"SharedKey $($storageAccount):$signature"
}

Ilya‘s RFC on Get-StringHash should help make this simpler and more readable eliminating several lines of code from that function.

Once I had the module working in the command line, I validated it was correctly uploaded to Azure using Microsoft Azure Storage Explorer. Now I needed to have the script run regularly. I considered both Azure Automation and Azure Functions and decided to use the latter as it was newer, which gave me an opportunity to learn it. One immediate problem I had is that Azure Functions today only supports PowerShell v4. I originally used PowerShell classes for my internal types and thus changed it all to PSCustomObjects.
I’ve since contacted the Azure Functions team and asked them to support both Windows PowerShell v5.x and PowerShell Core 6.0 in the future.

With Azure Functions, you really only have the ability to run a PowerShell script. This means that unless you install the Azure PowerShell module at runtime (and PowerShellGet isn’t part of PowerShell v4), you really can only use what is available with PowerShell. Azure Automation would be better suited if you want to use modules.

I just cut and pasted the code out of my module into the web interface and added a call to my functions at the end supplying all the necessary parameters to make sure I was getting the right data from GitHub, and uploading the data correctly into AzureTable. One thing to note is that you’ll see I pass -UseBasicParsing to all my Invoke-WebRequest calls as the ParsedHtml property in the output relies on MSHTML which relies on Internet Explorer.
IE is not available in the Azure Function container your script is running in. I should also mention that I use both Invoke-WebRequest and Invoke-RestMethod where the former is needed when I need to access the response headers specifically for pagination of the GitHub API response which is handled by this bit of code:

if($null-ne$output.Headers.Link) {$links=$output.Headers.Link.Split(",").Trim()foreach($linkin$links) {if($link-match"<(?.*?)>;\srel=`"(?.*?)`"") {if($matches.rel-eq'next') {$query=$matches.url
            }
        }
    }
}

I’ll be working to add this capability into Invoke-RestMethod so this bit of code can be removed.

Building the Power BI visualization is a whole other topic and @MSFTzachal really did most of the work, but my recommendation is to use the Power BI desktop app which I found easier and more powerful than the current web interface.

Steve Lee
Principal Software Engineer Manager
PowerShell Core

Announcing SC 2016 DPM Guest Blog Series

$
0
0

SC 2016 DPM came with many new features, as Modern Backup Storage and RCT based Hyper-V VM Backups. Hence, SCDPM is a complete backup solution, protecting workloads as SQL, SharePoint, Exchange, Hyper-V VMs, File Servers, and Clients, which may be running on Physical Servers, or be virtualized. While backing these up, using the savings and efficiencies of Modern Backup Storage, SCDPM ensures that you do not miss your backup SLAs, and reduces your storage consumption drastically.

Further, SCDPM integration with Azure ensures a no-hassle setup for your long term retention, offsite copy, and compliance needs.

dpm-overview

To help you understand these features, and DPM Deployments further, we have a series of blogs by experts in the field talking about how SCDPM, with Modern Backup Storage, can be configured to back up different workloads in various configurations.

As the first part of the blog series, Aidan Finn talks about what he found to be the Top 5 features in SC 2016 DPM.

Get SC 2016 DPM Now! 

You can get SCDPM 2016 up and running in ten minutes by downloading Evaluation VHD.  Questions? Reach out to us at AskAzureBackupTeam@microsoft.com.

If you are new to Azure Backup and want to enable Azure Backup for longterm retention, refer to Preparing to backup workloads to Azure with DPM.  Click for a free Azure trial subscription.

Here are some additional resources:


Visual Awesomeness Unlocked: Dual KPI custom visual

$
0
0
We have a very special new member to the custom visuals gallery: the Dual KPI. Dual KPI efficiently visualizes two measures over time. It shows their trend based on a joint timeline, while absolute values may use different scales. The reason this visualization is special is because we use it at Microsoft in executive dashboards to monitor usage and user satisfaction for each product, or when an executive wants to keep an eye on two KPIs at the same time (for example Profit and Market share or Sales and Profit).

Load Data from Azure Data Lake into Azure SQL Data Warehouse at 3TB/Hour

$
0
0

Re-posted from the Azure blog.

Azure SQL Data Warehouse (Azure SQL DW, or just SQL DW for short) is a SQL-based fully managed, petabyte-scale data warehousing solution in the cloud. It is highly elastic, enabling you to provision in minutes and scale capacity in seconds. You can scale compute and storage independently, allowing you to burst compute for complex analytical workloads or scale down your warehouse for archival scenarios. What’s more, you can pay by usage, rather than being locked into expensive predefined cluster configurations.

Azure Data Lake (ADL) is a no-limits data lake optimized for massively parallel processing, and it lets you store and analyze petabyte-size files and trillions of objects.

A common use case involving ADL Store (ADLS) and SQL DW is the following: Raw data is ingested into ADLS from a variety of sources. ADL Analytics (ADLA) is used to clean and process the data into a loading-ready format. From there, high value data is imported into Azure SQL DW for interactive analytics.

Until recently, the data in ADLS would be loaded into SQL DW using row-by-row insertion which, obviously, consumed time and meant delays in how quickly data could be explored to gain useful business insights.

However, as we recently announced, with SQL DW PolyBase support for ADLS, you can now load data directly from ADLS into your SQL DW instance using External Tables at nearly 3TB per hour. Because SQL DW can now ingest data directly from Azure Storage Blob and ADLS, you can load data from any Azure storage service, giving you the flexibility to choose what’s right for your application. The picture below captures the “Before” and “After” situation.


Intrigued? Read this post to learn more, including how to connect ADLS to SQL DW, and best practices for loading data. Learn more about the new PolyBase capability here. You can also check out a short video clip on how to use this new feature:


If you already have an Azure Data Lake Store, you can try loading your data into SQL Data Warehouse. For those of you still exploring Azure Data Lake, check out these nice ADLS tutorials which will get you up and running.

CIML Blog Team

Episode 117 with Jeremy Thake on Microsoft Teams and extensibility—Office 365 Developer Podcast

$
0
0

In episode 117 of the Office 365 Developer Podcast, Richard diZerega and Andrew Coates are joined by Jeremy Thake to discuss Microsoft Teams and extensibility.

Download the podcast.

Weekly updates

Show notes

Got questions or comments about the show? Join the O365 Dev Podcast on the Office 365 Technical Network. The podcast RSS is available on iTunes or search for it at “Office 365 Developer Podcast” or add directly with the RSS feeds.feedburner.com/Office365DeveloperPodcast.

About Jeremy Thake

JThakeJeremy Thake is the VP of Product Technology at Hyperfish. With over 15 years of experience in the industry, focused on Microsoft technology. His experience has ranges from consulting, development, marketing and product management. Jeremy worked at Microsoft for three years on Office 365 extensibility and Azure application platform space. He has spoken across the globe to business and developer audiences. He was recognized by Microsoft for five years as a SharePoint MVP before joining Microsoft for his expertise and contributions to the community.

About the hosts

RIchard diZeregaRichard is a software engineer in Microsoft’s Developer Experience (DX) group, where he helps developers and software vendors maximize their use of Microsoft cloud services in Office 365 and Azure. Richard has spent a good portion of the last decade architecting Office-centric solutions, many that span Microsoft’s diverse technology portfolio. He is a passionate technology evangelist and a frequent speaker at worldwide conferences, trainings and events. Richard is highly active in the Office 365 community, popular blogger at aka.ms/richdizz and can be found on Twitter at @richdizz. Richard is born, raised and based in Dallas, TX, but works on a worldwide team based in Redmond. Richard is an avid builder of things (BoT), musician and lightning-fast runner.


ACoatesA Civil Engineer by training and a software developer by profession, Andrew Coates has been a Developer Evangelist at Microsoft since early 2004, teaching, learning and sharing coding techniques. During that time, he’s focused on .NET development on the desktop, in the cloud, on the web, on mobile devices and most recently for Office. Andrew has a number of apps in various stores and generally has far too much fun doing his job to honestly be able to call it work. Andrew lives in Sydney, Australia with his wife and two almost-grown-up children.

Useful links

StackOverflow

Yammer Office 365 Technical Network

The post Episode 117 with Jeremy Thake on Microsoft Teams and extensibility—Office 365 Developer Podcast appeared first on Office Blogs.

Introducing Visually Rich and Highly Informative Weather Answers

$
0
0
Weather forecasts determine what we wear, when and where we take vacations, and can even affect our moods. Winter is an especially critical time for checking weather reports, especially if you’re the type that likes to hit the slopes. That’s why Bing has just released two new experiences designed to help you navigate every day weather, as well as check the latest snow fall on your favorite ski resort.
 
Enhanced Weather Experience
 
We refreshed the weather experience on Bing to help you plan your days using visually rich forecast information. Now, when you search for the weather in your city (for example, New York), Bing provides an animated experience using real-time forecasts. You can view the forecast by the hour using the interactive slider. Move the slider and the background animation and forecast data update to match the time of day, helping you to plan your day with confidence.
 
For major cities across the world, you’ll see the cityscapes in the background that adjust based on the time of day. You can see the Eiffel Tower light up Paris at night, or the sun glint off the Chicago River.  For other cities across the world we provide a color based gradient that indicates the weather conditions throughout the day. And we’ll continue to provide alerts during extreme weather conditions. 
 
To find weather information, type questions on Bing using natural language such as, “will it rain tomorrow” or “how is the weather this Friday?” You can even ask Bing follow-up questions. If you ask, “how is the weather in Seattle?” followed by “how about tomorrow?” Bing understands you are asking about tomorrow’s weather information for Seattle. It’s all about adapting to the way people speak, making it easier for you to get the information you need, quickly. 
 
 
how cold is this weekend in New York  how is the weather in Burbank
 
Ski Resort Snow Reports
 
If you ski or snowboard, you’re likely used to checking mountain resort conditions in advance of your trip. This means searching for the resort, going to the site, and clicking on several links. To help you get information on your favorite ski resort more quickly, Bing now provides the latest snow conditions and snow forecasts for ski resorts in the United States. Just search for a ski resort  and you’ll discover the snow surface condition, snow depth, past and predicted snow fall, weather forecast, links to live web cams, when available,  and latest status of the lifts and trails in the ski resort. 
 
stevens pass ski conditionsstevens pass
 

We hope these new weather experiences help you jump start your day or plan the perfect snow getaway. We’d love to hear your ideas for even more ways we can enhance Bing. To share your ideas, go to Bing Listens.

-The Bing Team


Using US Census data with Bing Maps

$
0
0

While creating the code samples for the Bing Maps V8 web control, we wanted to make the samples more realistic and use real data. As such, many of the Bing Maps V8 interactive code samples use data from a number of sources such as earthquake data from the USGS, satellite imagery of hurricanes from NASA, weather radar data from Iowa State University, and 2010 US Census data from the US Census Bureau.

To make the census data easy to integrate with Bing Maps applications, a subset of the data was uploaded into the Bing Spatial Data Services. This data has been exposed through 4 different data sources, each containing a census data based on a different type of geographical region; states, counties, ZCTA5 (Zip code tabulation area), and the 111th Congressional districts. The Bing Maps team has now made these data sources publicly available in the Bing Spatial Data Services so that you can easily use them in your application. Documentation on these data sources can be found here.

Creating a Census Choropleth map in Bing Maps V8

The following code sample shows how to create a Choropleth map (color coded boundary map) based on the population by state. This code sample uses the Bing Spatial Data Services module that is built into Bing Maps V8 to query the state level 2010 US Census data. This code sample also creates a legend with a gradient scalebar, which is used to color code the boundary data based on its relative population.


                src='http://www.bing.com/api/maps/mapcontrol?callback=GetMap'
            async defer>


            0
            10,000,000


Running this code will display a map of the USA with color coded US states based on population. A legend for the colors is overlaid on top the map as well. If you click on any of the states, a notification will appear which specifies which state was clicked and its population.

Try it now

Access additional US Census Data

The 2010 US Census data sources that are made available in the Bing Spatial Data Sources contain a subset of the data collected by the US Census, primarily population data. The US Census Bureau captures a lot of additional data which has not been included in the newly released data sources in the Bing Spatial Data Services. If you would like to access this data, there are a few options. One option is to download some of the existing geographic data sets from the US Census and upload them into the Bing Spatial Data Service. You can easily upload ESRI Shapefiles and KML files into the Bing Spatial Data Services to create a data source. Alternatively, you can upload this data into a spatial database such as SQL Azure and then expose the data through a custom web service.

Partner Solutions

Don’t want to develop a custom application yourself, take a look at one of these solutions.

Microsoft Power BI

Power BI along with the mapping functionality available in Excel make it easy to visualize data on Bing Maps. Here are a few useful blog posts on how to do this:

CensusViewer by MoonShadow Mobile

CensusViewer is an online application built by Moonshadow Mobile. This application gives you access to the 2010 and 2000 Census "Summary File 1" data from the U.S. Census Bureau as well as the selected American Community Survey (ACS) data and extensive data including registered voters and frequently updated commercial data sources. It is an excellent online tool for demographic analysis of the U.S. population. With CensusViewer you can navigate the census data from within the familiar Bing Maps interface coupled with Moonshadow’s cutting-edge database technology, to provide an intuitive platform for accessing and analyzing the data. Now, there are a couple different versions which give you access to different levels of data. If you want to try it out yourself, you’re in luck because there’s a free version. Here is a heat map created using this tool of the US population that is at or below the poverty level.

EasyTerritory.com

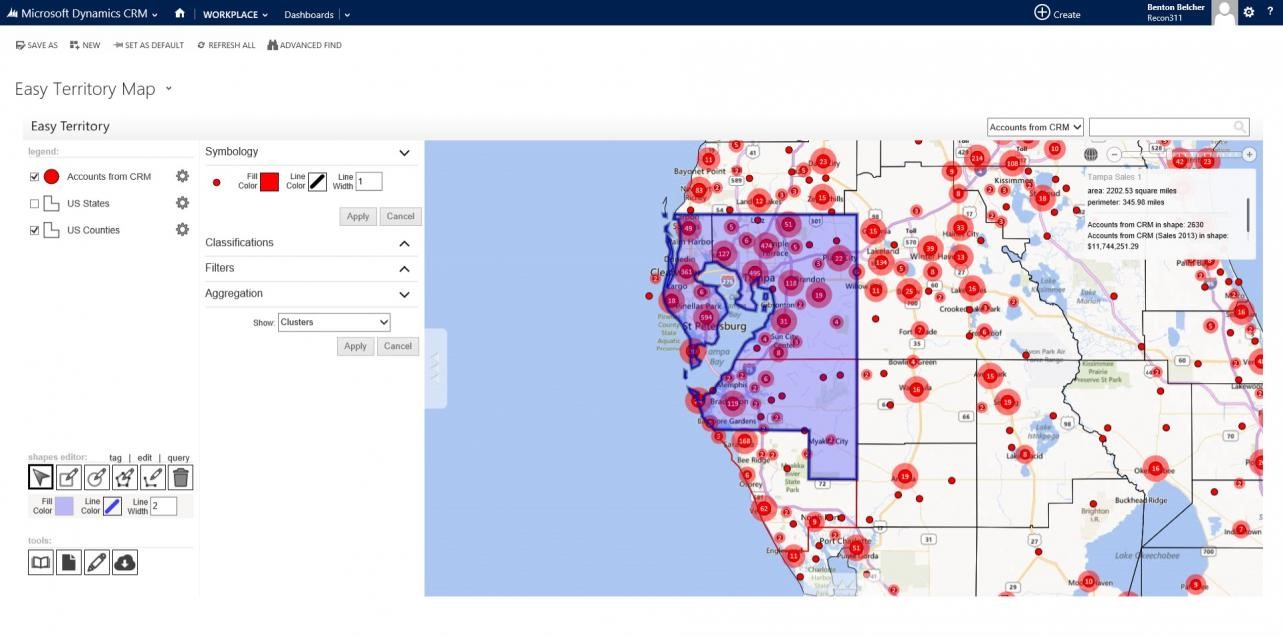
EasyTerritory is a leading map-based solution for territory management and geospatial business intelligence for Microsoft Dynamics CRM or SQL Server. Powered by Bing Maps for Enterprise, EasyTerritory allows users to geographically build and manage territories and get business-intel for leads, opportunities, contacts, accounts or any custom Dynamics CRM entity. EasyTerritory can optionally be deployed without Dynamics CRM using only SQL Server 2008, 2012, 2014, or SQL Azure. Features of EasyTerritory include, territory management, geospatial BI, US Census data sets, route planning and full legacy GIS integration. Out-of-the-box, this solution includes worldwide political boundary data as well as demographic for the US, Canada and parts of Europe. The EasyTerritory solution is available as an online service or can be deployed on-premises.

Overlay Network Driver with Support for Docker Swarm Mode Now Available to Windows Insiders on Windows 10

$
0
0

Windows 10 Insiders can now take advantage of overlay networking and Docker swarm mode  to manage containerized applications in both single-host and clustering scenarios.

Containers are a rapidly growing technology, and as they evolve so must the technologies that support them as members of a broader collection of compute, storage and networking infrastructure components. For networking, in particular, this means continually striving to achieve better connectivity, higher reliability and easier management for container networking. Less than six months ago, Microsoft released Windows 10 Anniversary Edition and Windows Server 2016, and even as our first versions of Windows with container support were being celebrated we were already hard at work on new container features, including several container networking features.

Our last Windows release showcased Docker Compose and service discovery—two key features for single-host container deployment and networking scenarios. Now, we’re expanding the reach of Windows container networking to multi-host (clustering) scenarios with the addition of a native overlay network driver and support for Docker swarm mode, available today to Windows Insiders as part of the upcoming Windows 10, Creators Update.

Docker swarm mode is Docker’s native orchestration tool, designed to simplify the experiencing of declaring, managing and scaling container services. The Windows overlay network driver (which uses VXLAN and virtual overlay networking technology) makes it possible to connect container endpoints running on separate hosts to the same, isolated network. Together, swarm mode and overlay enable easy management and complete scalability of your containerized applications, allowing you to leverage the full power of your infrastructure hosts.

What is “swarm mode”?

Swarm mode is a Docker feature that provides built in container orchestration capabilities, including native clustering of Docker hosts and scheduling of container workloads. A group of Docker hosts form a “swarm” cluster when their Docker engines are running together in “swarm mode.”

A swarm is composed of two types of container hosts: manager nodes, and worker nodes. Every swarm is initialized via a manager node, and all Docker CLI commands for controlling and monitoring a swarm must be executed from one of its manager nodes. Manager nodes can be thought of as “keepers” of the Swarm state—together, they form a consensus group that maintains awareness of the state of services running on the swarm, and it’s their job to ensure that the swarm’s actual state always matches its intended state, as defined by the developer or admin.

Note: Any given swarm can have multiple manager nodes, but it must always have at least one.

Worker nodes are orchestrated by Docker swarm via manager nodes. To join a swarm, a worker node must use a “join token” that was generated by the manager node when the swarm was initialized. Worker nodes simply receive and execute tasks from manager nodes, and so they require (and possess) no awareness of the swarm state.

swarmoverlayfunctionalview

Figure 1: A four-node swarm cluster running two container services on isolated overlay networks.

Figure 1 offers a simple visualization of a four-node cluster running in swarm mode, leveraging the overlay network driver. In this swarm, Host A is the manager node and Hosts B-D are worker nodes. Together, these manager and worker nodes are running two Docker services which are backed by a total of ten container instances, or “replicas.” The yellow in this figure distinguishes the first service, Service 1; the containers for Service 1 are connected by an overlay network. Similarly, the blue in this figure represents the second service, Service 2; the containers for Service 2 are also attached by an overlay network.

Note: In this case, the two Docker services happen to be connected by separate/isolated overlay networks. It is also possible, however, for multiple container services to be attached to the same overlay network.

Windows Network Stack Implementation

Under the covers, Swarm and overlay are enabled by enhancements to the Host Network Service (HNS) and Windows libnetwork plugin for the Docker engine, which leverage the Azure Virtual Filtering Platform (VFP) forwarding extension in the Hyper-V Virtual Switch. Figure 2 shows how these components work together on a given Windows container host, to enable overlay and swarm mode functionality.

Figure 2: Key components involved in enabling swarm mode and overlay networking on Windows container hosts.

Figure 2: Key components involved in enabling swarm mode and overlay networking on Windows container hosts.

The HNS overlay network driver plugin and VFP forwarding extension

Overlay networking was enabled with the addition of an overlay network driver plugin to the HNS service, which creates encapsulation rules using the VFP forwarding extension in the Hyper-V Virtual Switch; the HNS overlay plugin communicates with the VFP forwarding extension to perform the VXLAN encapsulation required to enable overlay networking functionality.

On Windows, the Azure Virtual Filtering Platform (VFP) is a software defined networking (SDN) element, installed as a programmable Hyper-V Virtual Switch forwarding extension. It is a shared component with the Azure platform, and was added to Windows 10 with Windows 10 Anniversary Edition. It is designed as a high performance, rule-flow based engine, to specify per-endpoint rules for forwarding, transforming, or blocking network traffic. The VFP extension has been used for implementing the l2bridge and l2tunnel Windows container networking modes and is now also used to implement the overlay networking mode. As we continue to expand container networking capabilities on Windows, we plan to further leverage the VFP extension to enable more fine-grained policy.

Enhancements to the Windows libnetwork plugin

Overlay networking support was the main hurdle that needed to be overcome to achieve Docker swarm mode support on Windows. Aside from that, additions also needed to be made to the Windows libnetwork Plugin—the plugin to the Docker engine that enables container networking functionality on Windows by facilitating communication between the Docker engine and the HNS service.

Load balancing: Windows routing mesh coming soon

Currently, Windows supports DNS Round-Robin load balancing between services. The routing mesh for Windows Docker hosts is not yet supported, but will be coming soon. Users seeking an alternative load balancing strategy today can setup an external load balancer (e.g. NGINX) and use Swarm’s publish-port mode to expose container host ports over which to load balance.

Boost your DevOps cycle and manage containers across Windows hosts by leveraging Docker swarm mode today

Together, Docker Swarm and support for overlay container networks enable multi-host scenarios and rapid scalability of your Windows containerized applications and services. This new support, combined with service discovery and the rest of the capabilities that you are used to leveraging in single-host configurations, makes for a clean and straight-forward experience developing containerized apps on Windows for multi-host environments.

To get started with Docker Swarm and overlay networking on Windows, start here .

The Datacenter and Cloud Networking team worked alongside our partners internally and at Docker to bring overlay networking mode and Docker swarm mode support to Windows. Again, this is an exciting milestone in our ongoing work to achieve better container networking support to Windows users. We’re constantly seeking more ways to improve your experience working with containers on Windows, and it’s only with your feedback that we can best decide what to do next to enable you and your DevOps teams.

We encourage you to share your experiences, questions and feedback with us, to help us learn more about what you’re doing with container networking on Windows today, and to understand what you’d like to achieve in the future. Visit our Contact Page to learn more about the forums that you can use to be in touch with us.

Import and analyze IIS Log files using SQL Server

$
0
0

IIS generates logs where are recorded many information about HTTP requests such as what Url was called, when the request happened, what is the origin, etc. If you want to analyze information from log files you can use use text search, regular expressions, or some log analysis tools; however, this might be tedious job. SQL Server enables you to import information from IIS log files into tables and use T-SQL language to analyze information from logs. In this post you can find how to load log files generated by IIS into SQL Server table using BULK INSERT commands, and analyze the date using T-SQL.

IIS Log files

IIS generates textual log files in following format:

#Software: Microsoft Internet Information Services 10.0
#Version: 1.0
#Date: 2016-12-14 20:43:33
#Fields: date time s-ip cs-method cs-uri-stem cs-uri-query s-port cs-username c-ip cs(User-Agent) cs(Referer) sc-status sc-substatus sc-win32-status time-taken
2016-12-14 20:43:33 10.0.0.4 GET /AdventureWorks - 80 - 168.62.177.232 Mozilla/5.0+(compatible;+MSIE+9.0;+Windows+NT+6.1;+Trident/5.0;+AppInsights) - 404 0 2 753
2016-12-14 20:43:33 10.0.0.4 GET /AdventureWorks/Employees/Create - 80 - 70.37.147.45 Mozilla/5.0+(compatible;+MSIE+9.0;+Windows+NT+6.1;+Trident/5.0;+AppInsights) - 404 0 2 7613
2016-12-14 20:44:07 10.0.0.4 GET /AdventureWorks/Employees/Create - 80 - 65.54.78.59 Mozilla/5.0+(compatible;+MSIE+9.0;+Windows+NT+6.1;+Trident/5.0;+AppInsights) - 404 0 2 54
2016-12-14 20:44:38 10.0.0.4 GET /AdventureWorks - 80 - 94.245.82.32 Mozilla/5.0+(compatible;+MSIE+9.0;+Windows+NT+6.1;+Trident/5.0;+AppInsights) - 404 0 2 202
2016-12-14 20:45:05 10.0.0.4 GET /AdventureWorks - 80 - 207.46.98.172 Mozilla/5.0+(compatible;+MSIE+9.0;+Windows+NT+6.1;+Trident/5.0;+AppInsights) - 404 0 2 43

These are textual files where cells are separated with space, and lines are separated with new-line. This can be easily imported into SQL Server using bcp, BULK INSERT commands.

Analyzing log files in SQL Server

First we need to create a table where IIS log files will be stored. Example is shown in the following code:

DROP TABLE IF EXISTS IISLOG
CREATE TABLE IISLOG (
 [DATE] [DATE] NULL,
 [TIME] [TIME] NULL,
 [s-ip] [VARCHAR] (16) NULL,
 [cs-method] [VARCHAR] (8) NULL, 
 [cs-uri-stem] [VARCHAR] (255) NULL,
 [cs-uri-query] [VARCHAR] (2048) NULL,
 [s-port] [VARCHAR] (4) NULL,
 [s-username] [VARCHAR] (16) NULL,
 [c-ip] [VARCHAR] (16) NULL,
 [cs(User-Agent)] [VARCHAR] (1024) NULL,
 [cs(Referer)] [VARCHAR] (4096) NULL, 
 [sc-STATUS] [INT] NULL,
 [sc-substatus] [INT] NULL,
 [sc-win32-STATUS] [INT] NULL,
 [time-taken] [INT] NULL,
 INDEX cci CLUSTERED COLUMNSTORE
)

When you look at the log file, you will see a line starting with #Fields: where you can see all columns that should be placed in destination table.

#Fields: date time s-ip cs-method cs-uri-stem cs-uri-query s-port cs-username c-ip cs(User-Agent) cs(Referer) sc-status sc-substatus sc-win32-status time-taken

You can create the table y looking in this list.
Note that I’m using CLUSTERED COLUMNSTORE INDEX on this table. This is not mandatory, but CCI is good solution for logs because it provides high compression of data and speed-up analytic.

Loading and analyzing logs

Now when we have destination table, we can load logs using BULK INSERT command:

BULK INSERT iislog
FROM 'D:\Data\Documents\u_ex161214.log'
WITH (
 FIRSTROW = 2,
 FIELDTERMINATOR = ' ',
 ROWTERMINATOR = '\n'
)

You can use space and new line as terminator. I’m using FIRSTROW=2 to ignore header row. Now, when we have all data in table, we can use standard SQL to analyze it:

select [cs-uri-stem], avg([time-taken])
from IISLOG
group by [cs-uri-stem]
order by avg([time-taken]) desc

Once you load logs into table, you can perform any kind of analysis using T-SQL.


Revolutionizing Retail Through Personalization and Advanced Analytics – Free White Paper & Webinar

$
0
0

The way people shop has changed considerably in recent years. These days, people comparison shop on the go, receive promotional deals at their fingertips, and all get the information they need to make buying decisions in near real time.

If you are in the retail business, you need to get ahead of the curve and meet your customers where they are. You need to master every tool that offers you an edge in a hyper competitive marketplace. Customer experience is the name of the game, and retailers must address the digital disruption caused by new technologies – both in the virtual world and at brick and mortar stores. Retail executives are feeling the pressure of keeping up during these challenging times – in a Microsoft survey of 100 executives, it was no surprise that 73 percent said that the retail marketplace is changing, with 40 percent noting that the pace of change is rapid.

Cloud-based data analytics can help retailers anticipate product trends, forecast consumer demand, and create individualized experiences that build greater customer loyalty and boost sales.

Microsoft Advanced Analytics allows retailers to use all available data to get a deeper understanding of their targeting strategy, optimize lead generation tactics, and improve customer experience. Retailers can embrace digital disruption, using it to create tailored product recommendations and offers that send customers to their storefronts, real or virtual.

To help retail businesses make more informed decisions, we have a free white paper you can download, Retail Insights: Harnessing the power of data.


Once you’ve read the white paper, do join us for a free webinar on Empowering Your Retail Business with Advanced Analytics. The webinar is on Thursday, February 16th, 2017 at 10:00AM Pacific / 1:00PM Eastern.


During the webinar, Shish Shridhar, Retail Industry Solutions Director at Microsoft, and Kuber Sharma, Product Marketing Manager for Advanced Analytics and Machine Learning at Microsoft, will share real-world customer examples of business success through data analytics, and explore how businesses can get started on their own transformation.

Register for the webinar here or by clicking on the above image. We hope to see many of you there!

CIML Blog Team

Congratulations to this month's Featured Data Stories Gallery submissions

$
0
0
Last month we put out the call for submissions using free public datasets -- along with other topics that interest you -- for the Data Stories Gallery, and we got some fantastic entries! Congratulations to the grand winner and runners-up. The inspiration topic for this month is: mapping! We want to see your best reports that involve maps and geographic data.

Announcing Azure SQL Database Threat Detection general availability coming in April 2017

$
0
0

Today we are happy to announce that Azure SQL Database Threat Detection will be generally available in April 2017. Through the course of the preview we optimized our offering and it has received 90% positive feedback from customers regarding the usefulness of SQL threat alerts. At general availability, SQL Database Threat Detection will cost of $15 / server / month. We invite you to try it out for 60 days for free.

What is Azure SQL Database Threat Detection?

Azure SQL Database Threat Detection provides an additional layer of security intelligence built into the Azure SQL Database service. It helps customers using Azure SQL Database to secure their databases within minutes without needing to be an expert in database security. It works around the clock to learn, profile and detect anomalous database activities indicating unusual and potentially harmful attempts to access or exploit databases.

How to use SQL Database Threat Detection

  • Just turn it ON - SQL Database Threat Detection is incredibly easy to enable. You simply switch on Threat Detection from the Auditing & Threat Detection configuration blade in the Azure portal, select the Azure storage account (where the SQL audit log will be saved) and configure at least one email address for receiving alerts.
  • Real-time actionable alerts - SQL Database Threat Detection runs multiple sets of algorithms which detect potential vulnerabilities and SQL injection attacks, as well as anomalous database access patterns (such as access from an unusual location or by an unfamiliar principal). Security officers or other designated administrators get email notification once a threat is detected on the database. Each notification provides details of the suspicious activity and recommends how to further investigate and mitigate the threat.
  • Live SQL security tile - SQL Database Threat Detection integrates its alerts with Azure Security Center. A live SQL security tile within the database blade in Azure portal tracks the status of active threats. Clicking on the SQL security tile launches the Azure Security Center alerts blade and provides an overview of active SQL threats detected on the database. Clicking on a specific alert provides additional details and actions for investigating and preventing similar threats in the future.
  • Investigate SQL threat - Each SQL Database Threat Detection email notification and Azure Security Center alert includes a direct link to the SQL audit log. Clicking on this link launches the Azure portal and opens the SQL audit records around the time of the event, making it easy to find the SQL statements that were executed (who accessed, what he did and when) and determine if the event was legitimate or malicious (e.g. application vulnerability to SQL injection was exploited, someone breached sensitive data, etc.).

ThreatDetectionNewImage

Recent customer experiences using SQL Database Threat Detection

During our preview, many customers benefited from the enhanced security SQL Database Threat detection provides.

Case #1: Anomalous access from a new network to production database

Justin Windhorst, Head of IT North America at Archroma

“Archroma runs a custom built ERP/e-Commerce solution, consisting of more than 20 Web servers and 20 Databases using a multi-tier architecture, with Azure SQL Database at its core.  I love the built-in features that bring added value such as the enterprise level features: SQL Database Threat Detection (for security) and Geo Replication (for availability).  Case in point: With just a few clicks, we successfully enabled SQL Auditing and Threat Detection to ensure continuous monitoring occurred for all activities within our databases.  A few weeks later, we received an email alert that "Someone has logged on to our SQL server from an unusual location”. The alert was triggered as a result of unusual access from a new network to our production database for testing purposes.  Knowing that we have the power of Microsoft behind us that automatically brings to light anomalous such as these gives Archroma incredible peace of mind, and thus allows us to focus on delivering a better service.”

Case #2: Preventing SQL Injection attacks

Fernando Sola, Cloud Technology Consultant at HSI

“Thanks to Azure SQL Database Threat Detection, we were able to detect and fix vulnerabilities to SQL injection attacks and prevent potential threats to our database. I was very impressed with how simple it was to enable threat detection using the Azure portal. A while after enabling Azure SQL Database Threat Detection, we received an email notification about ‘An application generated a faulty SQL statement on our database, which may indicate a vulnerability of the application to SQL injection.’  The notification provided details of the suspicious activity and recommended actions how to observe and fix the faulty SQL statement in our application code using SQL Audit Log. The alert also pointed me to the Microsoft documentation that explained us how to fix an application code that is vulnerable to SQL injection attacks. SQL Database Threat Detection and Auditing help my team to secure our data in Azure SQL Database within minutes and with no need to be an expert in databases or security.”

Summary

We would like to thank all of you that provided feedback and shared experiences during the public preview. Your active participation validated that SQL Database Threat Detection provides an important layer of security built into the Azure SQL Database service to help secure databases without the need to be an expert in database security.

Click the following links for more information to:

Preview the new enhancements to Azure Security Center

$
0
0

While the cloud may have initially raised some security concerns among enterprises, Microsoft is changing those dynamics. By tapping into the collective power of millions of cloud customers, Microsoft can help each customer more effectively defend against the increasing volume and sophistication of attacks. Azure Security Center has released a number of new capabilities that leverage this collective intelligence to not only detect threats, but also do a better job of preventing them.

Advanced cloud defenses  

Some traditional security controls deliver important protection from threats, but have proved to be too costly to configure and maintain. By applying prescriptive analytics to application and network data, learning the behavior of a machine or a group of machines, and combining these insights with broad cloud reputation, Azure Security Center empowers customers to realize the benefits of these controls without introducing any management overhead.

  • Application Whitelisting - Once compromised, an attacker will likely execute malicious code on a VM as they take action toward their objectives. Whitelisting legitimate applications helps block unknown and potentially malicious applications from running, but historically managing and maintaining these whitelists has been problematic. Azure Security Center can now automatically discover, recommend whitelisting policy for a group of machines and apply these settings to your Windows VMs using the built-in AppLocker feature. After applying the policy, Azure Security Center continues to monitor the configuration and suggests changes making it easier than ever before to leverage the powerful security benefits of application whitelisting.
  • Just-In-Time (JIT) Network Access to VMs - Attackers commonly target open network ports (RDP, SSH, etc.) with Brute Force attacks as a means to gain access to VMs running in the cloud. By only opening these ports for a limited time when needed to connect remotely to the VM, Azure Security Center can significantly reduce the attack surface and subsequently the risk that the VM will be compromised.

For an early preview, join the Azure Advisors community and then Azure Security Center Advisors group.

Advanced threat detection

Our security research and data science teams are constantly monitoring the threat landscape and adding new or enhancing current detection algorithms. Azure Security Center customers benefit from these innovations as algorithms are continuously released, validated, and tuned without the need to worry about keeping signatures up to date. Here are some of the most recent updates:

  • Harnessing the Power of Machine Learning - Azure Security Center has access to a vast amount of data about cloud network activity, which can be used to detect threats targeting your Azure deployments. For example:
    • Brute Force Detections - Machine learning is used to create a historical pattern of remote access attempts, which allows it to detect brute force attacks against SSH, RDP, and SQL ports. In the coming weeks, these capabilities will be expanded to also monitor for network brute force attempts targeting many applications and protocols, such as FTP, Telnet, SMTP, POP3, SQUID Proxy, MongoDB, Elastic Search, and VNC.
    • Outbound DDoS and Botnet Detection - A common objective of attacks targeting cloud resources is to use the compute power of these resources to execute other attacks. New detection algorithms are generally available in Azure Security Center, which clusters virtual machines together according to network traffic patterns and uses supervised classification techniques to determine if they are taking part in a DDoS attack. Also, in private preview are new analytics that detect if a virtual machine is part of a botnet. It works by joining network data (IPFIX) with passive DNS information to obtain a list of domains accessed by the VM and using them to detect malicious access patterns.
  • New Behavioral Analytics Servers and VMs - Once a server or virtual machine is compromised, attackers employ a wide variety of techniques to execute malicious code on that system while avoiding detection, ensuring persistence, and obviating security controls. Additional behavioral analytics are now generally available in Azure Security Center to help identify suspicious activity, such as process persistency in the registry, processes masquerading as system processes, and attempts to evade application whitelisting. In addition, new analytics have been released to public preview that are designed specifically for Windows Server 2016, for example activity related to SAM and admin account enumeration. Over the next few weeks, many of the behavioral analytics available for Windows VMs will be available for Linux VMs as well. Operations Management Suite Security users will also benefit from these new detections for non-Azure servers and VMs.
  • Azure SQL Database Threat Detection - Threat Detection for Azure SQL Database, which identifies anomalous database activities indicating unusual and potentially harmful attempts to access or exploit databases, announced upcoming general availability in April 2017. You can view alerts from SQL Database Threat Detection in Azure Security Center, along with additional details and actions for investigating and preventing similar threats in the future.

To take advantage of these and other advanced detection capabilities, select the Standard tier or free 90 Day Trial from the Pricing Tier blade in the Security Center Policy. Learn more about pricing.

Integrated partners   

Azure Security Center makes it easy for you to bring your trusted cloud security vendors with you to the cloud. Recent additions include:

  • Fortinet NGFW and Cisco ASA - In addition to solutions from Checkpoint and Barracuda, ASC now features integration with Fortinet and Cisco ASA next generation firewalls. ASC automatically discovers deployments where these solutions are recommended (based on the policy you set), streamlines deployment and monitoring, and integrates security alerts from these partner solutions - making it easier than ever to bring your trusted security solutions with you to the cloud.

Azure Security Center requires zero setup - simply open Security Center in the Azure Portal. Use the free version or upgrade to the 90 Day Trial to enable advanced prevention and threat detection.

Microsoft’s SQL Platform continues to lead the market with advanced data security

$
0
0

This post was authored by Rohan Kumar

Securing customer data while maintaining the highest levels of privacy have always been top priorities for Microsoft and the SQL organization. As a result, SQL Server, which also powers Azure SQL Database and Azure SQL Data Warehouse, continues to be one of the most secure Relational Database Management Systems (RDBMS) on the market.[1]

At the RSA Conference last year, we talked about our commitment to security and privacy. I want to share a few examples of industry-leading security features we shipped since then and update you on our plans to deliver the highest levels of security across the SQL Database product lineup.

Announcing the April general availability of Azure SQL Database Threat Detection for proactive monitoring and alerting of suspicious database activities and potential vulnerabilities.

Using machine learning, SQL Database Threat Detection continuously monitors and profiles application behavior, and detects suspicious database activities to identify unusual and potentially harmful attempts to access, breach or exploit sensitive data in databases. When suspicious activity is detected, security officers and designated administrators get immediate notification or can view the alerts in the Azure Security Center along with recommendations for how to mitigate the threats. SQL Database Threat Detection can detect potential vulnerabilities and SQL injection attacks, as well as anomalous activities such as data access from unusual locations or by unfamiliar principals.

Frans Lytzen, CTO of New Orbit, UK, is early adopter of SQL Database Threat Detection, said “I’ve seen it detect potential SQL injection attacks […]. This is a useful feature to potentially detect both external and internal attacks […]. You have nothing to lose by switching it on.” SQL Database Threat Detection is simple to configure via the Azure portal and requires no modifications to your existing T-SQL code or client applications. Fernando Sola, Cloud Technology Consultant at HSI adds, “Thanks to Azure SQL Database Threat Detection, we were able to detect and fix vulnerabilities to SQL injection attacks and prevent potential threats to our database. I was very impressed with how simple it was to enable Threat Detection using the Azure portal.”

State-of-the-art protection of sensitive data in flight, at rest and during query processing with Always Encrypted in SQL Server 2016 and Azure SQL Database has been generally available since July 2016.

Always Encrypted is an industry-first feature that offers unparalleled data security against breaches involving the theft of critical data. For example, with Always Encrypted, customers’ credit card numbers are stored encrypted in the database at all times, even during query processing, allowing decryption at the point of use by authorized staff or applications that need to process that data. Encryption keys are managed outside of the database for maximum safety and separation of duties. Only authorized users with access to the encryption keys can see unencrypted data while using applications.

Financial Fabric, a global provider of big data analytics to hedge funds and institutional investors, uses Always Encrypted to ensure that sensitive data is encrypted from the moment it is ingested in Azure SQL Database until it is accessed by authorized end users. Paul Stirpe, CTO of Financial Fabric states, “With Always Encrypted in Azure SQL Database, analysts can aggregate information, work on client data and positions, and provide numbers without revealing highly sensitive, identifiable information.” You can read more about how Financial Fabric is transforming hedge fund management with Azure and SQL Database here.

Always Encrypted is simple to use, transparent, and ready to protect your data.  Client drivers have been enhanced to work in conjunction with SQL Server and Azure SQL Database to decrypt and encrypt data at the point of use, requiring only minimal modifications to your applications.

SQL Dynamic Data Masking is another security capability that’s built right into the relational engine. Itlimits sensitive data exposure by masking the data when accessed by non-privileged users or applications. Any data in the result set of a query over masked database fields is obfuscated on the fly while the data in the database remains unchanged.  SQL’s Dynamic Data Masking requires no changes to the application and is simple to configure. What’s more, for users of Azure SQL Database, Dynamic Data Masking can automatically discover potentially sensitive data and suggest the appropriate masks to be applied.

We have also delivered single sign-on for Azure SQL Database and SQL DW with Azure Active Directory Authentication which was made generally available in August 2016, and customers can now preview secure, compliant management of the TDE encryption keys using Azure Key Vault.

Securing customer data doesn’t end with the features we ship. Security and privacy are built right into our products, beginning with the Security Development Lifecycle (SDL) that focuses on security at every step – from the initial planning, to launch, to making sure the service and our infrastructure are continuously monitored and updated to stay ahead of new threats.

For example, our scanning and threat protection tools run continuously against our service to look for viruses, ensure software is properly patched, and identify potential vulnerabilities and misconfigurations. “Just-in-time” access management enables us to operate our service with no standing access to production servers and their databases. Instead, employees are required to request access which is reviewed and granted for the narrowest possible scope and limited time only. In addition, much of what we do internally has found its way back into customer facing products, Azure SQL Database Threat Detection is one example. I also encourage you to read our whitepaper on protecting data and privacy in the Azure cloud to learn about how we work hard every day to earn your trust.

Going forward we want to dramatically simplify security to ensure all of our customers can implement and operate an effective, defense-in-depth strategy for their sensitive data independent of their level of expertise. For example, we believe that securing a SQL database should be as simple as identifying the desired protection level (e.g., High Business Impact) and applying the appropriate policy to secure the database. Microsoft’s SQL Server platform will do the rest, including identifying which data is sensitive and which features are needed to secure the data. While the database is in use, it will continuously monitor for changes in the configuration and any unusual activities that may be signs of malicious attacks.

Although this remains a vision for now, we continue to invest in features that combine machine learning and adaptive behavior with state-of-the-art security and privacy protection to get us closer to our goals.

Our customers are taking notice, as voiced by Paul Stirpe from Financial Fabric who said “[… the]new technology that has been rolled out by Microsoft is a game-changer. Cloud security has fundamentally shifted as of now.

We believe our vision of the intelligent, always secure database will democratize security in the same way relational query processing democratized data management in the 1970’s by enabling anyone who could write SQL queries to manage and access large databases.


[1] Based on vulnerabilities reported in the NIST National Vulnerability Database (nvd.nist.gov) for the last 6 years.

Viewing all 13502 articles
Browse latest View live


<script src="https://jsc.adskeeper.com/r/s/rssing.com.1596347.js" async> </script>